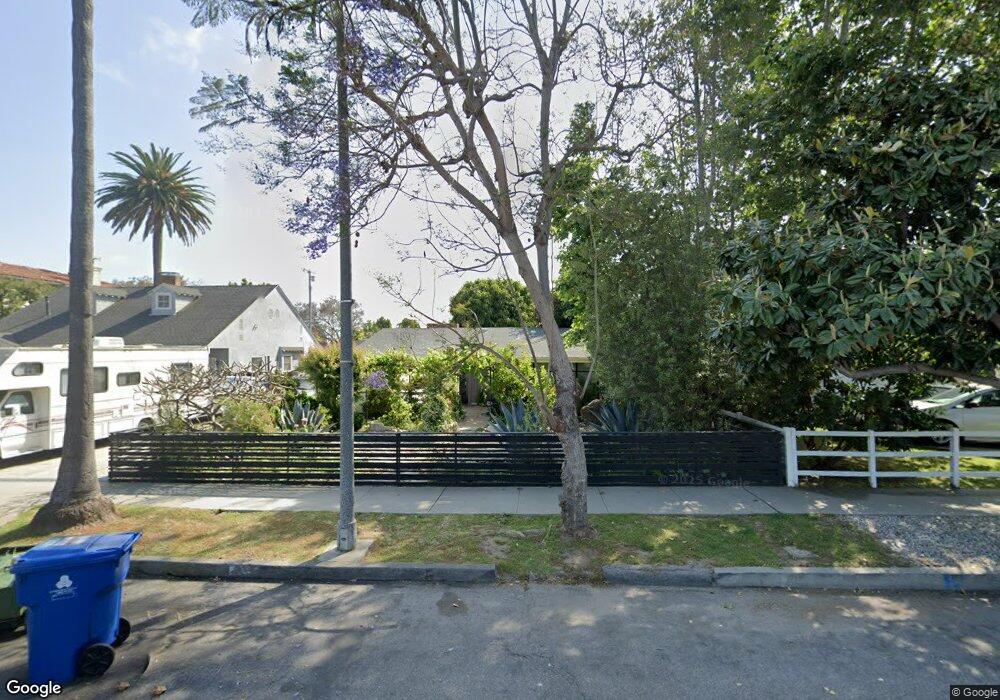
3723 Grand View Blvd Los Angeles, CA 90066
Mar Vista NeighborhoodEstimated Value: $1,283,000 - $2,134,000
2
Beds
2
Baths
1,713
Sq Ft
$961/Sq Ft
Est. Value
About This Home
This home is located at 3723 Grand View Blvd, Los Angeles, CA 90066 and is currently estimated at $1,645,880, approximately $960 per square foot. 3723 Grand View Blvd is a home located in Los Angeles County with nearby schools including Grand View Boulevard Elementary School, Daniel Webster Middle School, and Venice High School.
Ownership History
Date
Name
Owned For
Owner Type
Purchase Details
Closed on
May 9, 2025
Sold by
Combs Erika and Soja-Combs Erika Kumari
Bought by
Soja-Combs Erika Kumari and Combs Sean Jaime
Current Estimated Value
Home Financials for this Owner
Home Financials are based on the most recent Mortgage that was taken out on this home.
Original Mortgage
$250,000
Outstanding Balance
$249,110
Interest Rate
6.62%
Mortgage Type
Credit Line Revolving
Estimated Equity
$1,396,770
Purchase Details
Closed on
Feb 3, 2021
Sold by
Irrevocable Trust
Bought by
Combs Erika
Purchase Details
Closed on
Feb 22, 2017
Sold by
Soja Maureen P
Bought by
Soja Maureen P and The Survivors Revocable Trust Share Of T
Purchase Details
Closed on
Aug 15, 2001
Sold by
Soja Edward W
Bought by
Soja Edward W and Soja Maureen P
Create a Home Valuation Report for This Property
The Home Valuation Report is an in-depth analysis detailing your home's value as well as a comparison with similar homes in the area
Home Values in the Area
Average Home Value in this Area
Purchase History
| Date | Buyer | Sale Price | Title Company |
|---|---|---|---|
| Soja-Combs Erika Kumari | -- | Atlas Title | |
| Combs Erika | $865,000 | None Listed On Document | |
| Combs Erika | -- | None Listed On Document | |
| Soja Maureen P | -- | None Available | |
| Soja Edward W | -- | -- | |
| Soja Edward W | -- | -- |
Source: Public Records
Mortgage History
| Date | Status | Borrower | Loan Amount |
|---|---|---|---|
| Open | Soja-Combs Erika Kumari | $250,000 |
Source: Public Records
Tax History Compared to Growth
Tax History
| Year | Tax Paid | Tax Assessment Tax Assessment Total Assessment is a certain percentage of the fair market value that is determined by local assessors to be the total taxable value of land and additions on the property. | Land | Improvement |
|---|---|---|---|---|
| 2025 | $2,574 | $193,543 | $105,970 | $87,573 |
| 2024 | $2,574 | $189,749 | $103,893 | $85,856 |
| 2023 | $2,533 | $186,029 | $101,856 | $84,173 |
| 2022 | $2,510 | $182,382 | $99,859 | $82,523 |
| 2021 | $2,387 | $178,806 | $97,901 | $80,905 |
| 2020 | $2,406 | $176,974 | $96,898 | $80,076 |
| 2019 | $2,321 | $173,505 | $94,999 | $78,506 |
| 2018 | $2,214 | $170,104 | $93,137 | $76,967 |
| 2017 | $2,170 | $166,769 | $91,311 | $75,458 |
| 2016 | $2,103 | $163,500 | $89,521 | $73,979 |
| 2015 | $2,074 | $161,045 | $88,177 | $72,868 |
| 2014 | $2,092 | $157,891 | $86,450 | $71,441 |
Source: Public Records
Map
Nearby Homes
- 3733 S Centinela Ave
- 3617 Ocean View Ave
- 3616 Mountain View Ave
- 12028 Venice Blvd
- 3783 Colonial Ave
- 3613 Inglewood Blvd
- 11957 Modjeska Place
- 3577 Inglewood Blvd
- 12530 Venice Blvd Unit 8
- 12413 Westminster Ave
- 3724 Stewart Ave
- 3524 Grand View Blvd
- 11856 Venice Blvd
- 12614 Venice Blvd
- 3803 S Verona Ct
- 12602 Pacific Ave Unit 5
- 3743 Mclaughlin Ave
- 12400 Mitchell Ave
- 3968 Inglewood Blvd Unit 2
- 12111 Washington Place
- 3715 Grand View
- 3715 Grand View Blvd
- 3725 Grand View Blvd
- 3711 Grand View Blvd
- 3727 Grand View Blvd
- 3707 Grand View Blvd
- 3722 Ocean View Ave
- 3728 Ocean View Ave
- 3716 Ocean View Ave
- 3741 Grand View Blvd
- 3710 Ocean View Ave
- 3734 Ocean View Ave
- 3701 Grand View Blvd
- 3702 Ocean View Ave
- 3738 Ocean View Ave
- 3712 Grand View Blvd
- 3720 Grand View Blvd
- 3700 Ocean View Ave
- 3734 Grand View Blvd
- 3749 Grand View Blvd