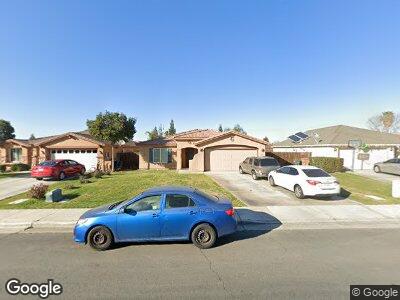
3724 Fuschia Ct Bakersfield, CA 93313
Venola NeighborhoodEstimated Value: $369,000 - $378,540
4
Beds
2
Baths
1,776
Sq Ft
$211/Sq Ft
Est. Value
About This Home
This home is located at 3724 Fuschia Ct, Bakersfield, CA 93313 and is currently estimated at $373,885, approximately $210 per square foot. 3724 Fuschia Ct is a home located in Kern County with nearby schools including Roy W. Loudon Elementary School, Fred L. Thompson Junior High School, and Ridgeview High School.
Ownership History
Date
Name
Owned For
Owner Type
Purchase Details
Closed on
Jan 27, 2009
Sold by
The Bank Of New York
Bought by
Crowell Bernard and Crowell Sheila
Current Estimated Value
Home Financials for this Owner
Home Financials are based on the most recent Mortgage that was taken out on this home.
Original Mortgage
$151,200
Interest Rate
4.92%
Mortgage Type
FHA
Purchase Details
Closed on
Aug 5, 2008
Sold by
Kaur Manjit and Singh Rashpal
Bought by
The Bank Of New York and Cwabs Inc Asset Backed Certificates Seri
Purchase Details
Closed on
Mar 8, 2006
Sold by
Adh Corp
Bought by
Singh Rashpal and Kaur Manjit
Home Financials for this Owner
Home Financials are based on the most recent Mortgage that was taken out on this home.
Original Mortgage
$262,368
Interest Rate
10.5%
Mortgage Type
New Conventional
Create a Home Valuation Report for This Property
The Home Valuation Report is an in-depth analysis detailing your home's value as well as a comparison with similar homes in the area
Home Values in the Area
Average Home Value in this Area
Purchase History
| Date | Buyer | Sale Price | Title Company |
|---|---|---|---|
| Crowell Bernard | $154,000 | First American Title Company | |
| The Bank Of New York | $135,000 | Landsafe Title | |
| Singh Rashpal | $276,500 | First American Title Company |
Source: Public Records
Mortgage History
| Date | Status | Borrower | Loan Amount |
|---|---|---|---|
| Open | Crowell Bernard | $156,000 | |
| Closed | Crowell Bernard | $151,200 | |
| Previous Owner | Singh Rashpal | $262,368 |
Source: Public Records
Tax History Compared to Growth
Tax History
| Year | Tax Paid | Tax Assessment Tax Assessment Total Assessment is a certain percentage of the fair market value that is determined by local assessors to be the total taxable value of land and additions on the property. | Land | Improvement |
|---|---|---|---|---|
| 2024 | $2,963 | $194,409 | $31,552 | $162,857 |
| 2023 | $2,963 | $190,598 | $30,934 | $159,664 |
| 2022 | $2,860 | $186,862 | $30,328 | $156,534 |
| 2021 | $2,746 | $183,199 | $29,734 | $153,465 |
| 2020 | $2,694 | $181,322 | $29,430 | $151,892 |
| 2019 | $2,656 | $181,322 | $29,430 | $151,892 |
| 2018 | $2,540 | $174,283 | $28,288 | $145,995 |
| 2017 | $2,502 | $170,867 | $27,734 | $143,133 |
| 2016 | $2,346 | $167,518 | $27,191 | $140,327 |
| 2015 | $2,323 | $165,003 | $26,783 | $138,220 |
| 2014 | $2,266 | $161,772 | $26,259 | $135,513 |
Source: Public Records
Map
Nearby Homes
- 3718 Ridgemont St
- 5913 El Camino Ave
- 6300 Ringwood St
- 5907 Stacey St
- 3501 Springford Ct
- 4116 Margalo Ave
- 4204 Tyndall Ave
- 6201 Wible Rd Unit 25
- 6201 Wible Rd Unit 32
- 6201 Wible Rd Unit 42
- 6419 Ringsdale Ct
- 3604 Panama Ln
- 4400 Millbrook Way
- 6009 Cedar Glen Ln
- 3702 Whirlwind Dr
- 4212 Milo Ave
- 6351 Akers Rd Unit 122
- 6351 Akers Rd Unit 87
- 6351 Akers Rd Unit 17
- 4105 Thatch Ave
- 3724 Fuschia Ct
- 3728 Fuschia Ct Unit 1
- 3720 Fuschia Ct
- 3716 Fuschia Ct
- 3715 Ridgemont St
- 3719 Ridgemont St Unit 1
- 3711 Ridgemont St Unit 1
- 3712 Fuschia Ct
- 3707 Ridgemont St
- 3725 Fuschia Ct
- 3721 Fuschia Ct
- 3729 Fuschia Ct
- 5809 Honeysuckle Ave Unit 1
- 3717 Fuschia Ct
- 5805 Honeysuckle Ave
- 5813 Honeysuckle Ave
- 3703 Ridgemont St
- 3801 Ridgemont St
- 3708 Fuschia Ct
- 5903 Honeysuckle Ave