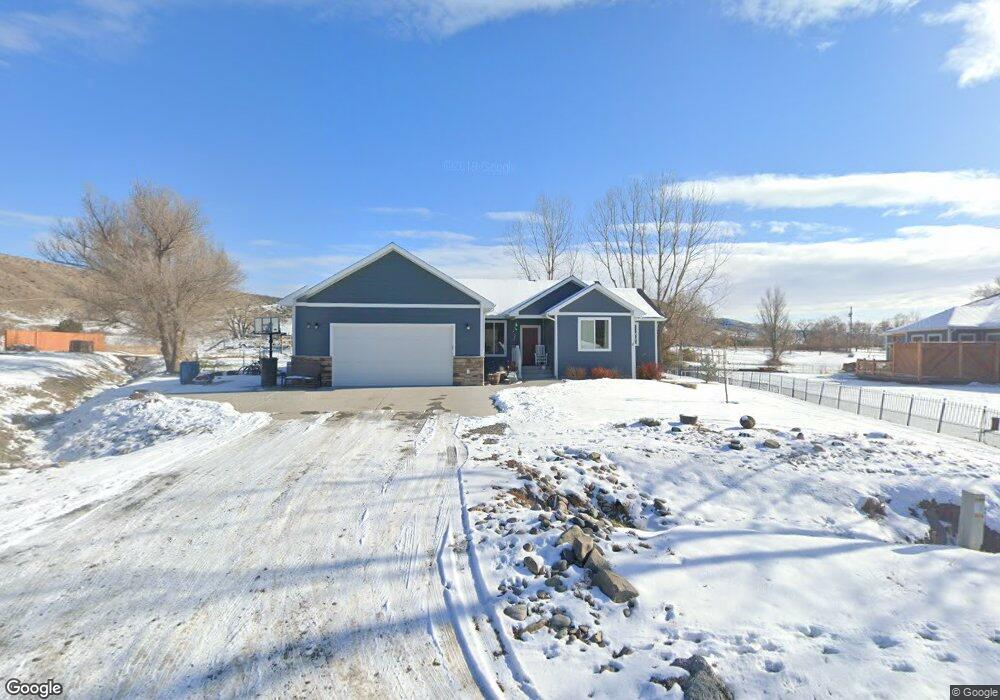
3725 Jene Helene Ave Billings, MT 59101
Estimated Value: $421,000 - $524,000
2
Beds
3
Baths
1,582
Sq Ft
$285/Sq Ft
Est. Value
About This Home
This home is located at 3725 Jene Helene Ave, Billings, MT 59101 and is currently estimated at $450,226, approximately $284 per square foot. 3725 Jene Helene Ave is a home with nearby schools including Blue Creek School, Riverside Junior High School, and Billings Senior High School.
Ownership History
Date
Name
Owned For
Owner Type
Purchase Details
Closed on
Nov 26, 2012
Sold by
Neumann Tony C
Bought by
Miller Kori Dawn
Current Estimated Value
Home Financials for this Owner
Home Financials are based on the most recent Mortgage that was taken out on this home.
Original Mortgage
$217,600
Outstanding Balance
$150,619
Interest Rate
3.35%
Mortgage Type
New Conventional
Estimated Equity
$299,607
Purchase Details
Closed on
Aug 23, 2012
Sold by
Jorden Ed and Jorden Karilee
Bought by
Neumann Tony C
Home Financials for this Owner
Home Financials are based on the most recent Mortgage that was taken out on this home.
Original Mortgage
$182,523
Interest Rate
3.53%
Mortgage Type
Construction
Purchase Details
Closed on
Nov 7, 2005
Sold by
Knox Dave Brian and Knox Sharon Yavonne
Bought by
Jorden Ed and Jorden Karilee
Purchase Details
Closed on
Aug 9, 2005
Sold by
Anderson Calvin A and Shirley A
Bought by
Brian Dave and Knox Sharon Yavonne
Create a Home Valuation Report for This Property
The Home Valuation Report is an in-depth analysis detailing your home's value as well as a comparison with similar homes in the area
Home Values in the Area
Average Home Value in this Area
Purchase History
| Date | Buyer | Sale Price | Title Company |
|---|---|---|---|
| Miller Kori Dawn | -- | Chicago Title | |
| Neumann Tony C | -- | None Available | |
| Jorden Ed | -- | None Available | |
| Brian Dave | -- | None Available |
Source: Public Records
Mortgage History
| Date | Status | Borrower | Loan Amount |
|---|---|---|---|
| Open | Miller Kori Dawn | $217,600 | |
| Previous Owner | Neumann Tony C | $182,523 |
Source: Public Records
Tax History Compared to Growth
Tax History
| Year | Tax Paid | Tax Assessment Tax Assessment Total Assessment is a certain percentage of the fair market value that is determined by local assessors to be the total taxable value of land and additions on the property. | Land | Improvement |
|---|---|---|---|---|
| 2025 | $2,520 | $440,000 | $41,827 | $398,173 |
| 2024 | $2,520 | $388,400 | $39,732 | $348,668 |
| 2023 | $2,503 | $388,400 | $39,732 | $348,668 |
| 2022 | $2,283 | $313,700 | $34,680 | $279,020 |
| 2021 | $2,301 | $313,700 | $0 | $0 |
| 2020 | $2,043 | $266,000 | $0 | $0 |
| 2019 | $2,043 | $266,000 | $0 | $0 |
| 2018 | $2,216 | $296,900 | $0 | $0 |
| 2017 | $1,951 | $296,900 | $0 | $0 |
| 2016 | $1,688 | $265,000 | $0 | $0 |
| 2015 | $1,608 | $265,000 | $0 | $0 |
| 2014 | $1,447 | $123,384 | $0 | $0 |
Source: Public Records
Map
Nearby Homes
- 3748 Blue Creek Rd
- 3947 Blue Creek Rd
- 3205 Deer Pass Trail
- 3992 Vista View Rd
- 3509 Mac Duff Cir
- 3525 Prestwick Rd
- 3041 Kincaid Rd
- 2914 Kincaid Rd
- 2604 Castle Pines Dr
- 3442 Castle Pines Dr
- 1811 Briarwood Blvd
- 3155 Mcmasters Rd
- 3335 Mcmasters Rd
- BCA Lot 3 Shaia Way
- BCA Lot 4 Shaia Way
- 2318 Glengarry Ln
- 2315 Glengarry Ln
- 1873 Weldon Rd
- 0 Vandaveer Rd
- 0 Colleen Dr
- 3340 Aqui Esta Dr
- 3332 Aqui Esta Dr
- 3705 Jene Helene Ave
- 3784 Jene Helene Ave
- 3344 Aqui Esta Dr
- 3645 Jene Helene Ave
- 3328 Aqui Esta Dr
- 3722 Jene Helene Ave
- 3310 Aqui Esta Dr
- 3638 Jene Helene Ave
- 3637 Jene Helene Ave
- 3839 Jene Helene Ave
- 3628 Sharon Dr
- 3629 Jene Helene Ave
- 3612 Sharon Dr
- 3875 Jene Helene Ave
- 3615 Jene Helene Ave
- 3625 Sharon Dr
- 3826 Blue Creek Rd
- 3808 Blue Creek Rd