Estimated Value: $455,000 - $535,000
3
Beds
3
Baths
2,490
Sq Ft
$198/Sq Ft
Est. Value
About This Home
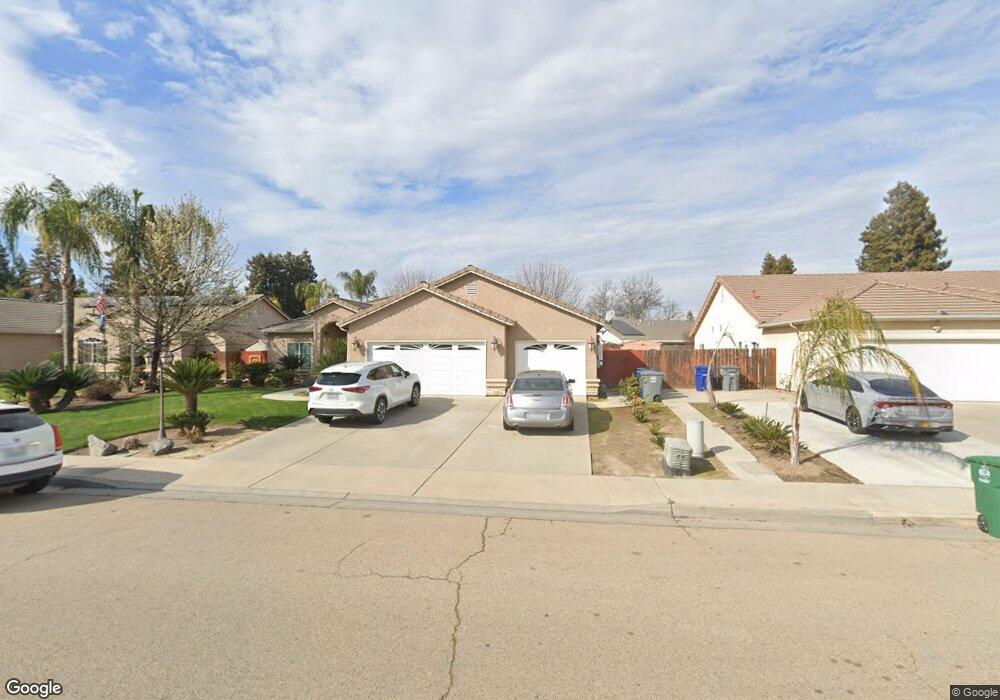
This home is located at 3725 Olive St, Selma, CA 93662 and is currently estimated at $493,055, approximately $198 per square foot. 3725 Olive St is a home located in Fresno County with nearby schools including Indianola Elementary School, Abraham Lincoln Middle School, and Selma High School.
Ownership History
Date
Name
Owned For
Owner Type
Purchase Details
Closed on
Jan 19, 2005
Sold by
Raven Development Inc
Bought by
Trevino Israel and Trevino Rosie
Current Estimated Value
Home Financials for this Owner
Home Financials are based on the most recent Mortgage that was taken out on this home.
Original Mortgage
$272,100
Outstanding Balance
$136,834
Interest Rate
5.69%
Mortgage Type
Purchase Money Mortgage
Estimated Equity
$356,221
Purchase Details
Closed on
Sep 2, 2004
Sold by
Raven Larry J and Raven Patricia E
Bought by
Raven Corbyn L and Raven Stephanie
Create a Home Valuation Report for This Property
The Home Valuation Report is an in-depth analysis detailing your home's value as well as a comparison with similar homes in the area
Home Values in the Area
Average Home Value in this Area
Purchase History
| Date | Buyer | Sale Price | Title Company |
|---|---|---|---|
| Trevino Israel | $286,500 | Financial Title Company | |
| Raven Development Inc | -- | Financial Title Company | |
| Raven Corbyn L | -- | Financial Title Company |
Source: Public Records
Mortgage History
| Date | Status | Borrower | Loan Amount |
|---|---|---|---|
| Open | Trevino Israel | $272,100 |
Source: Public Records
Tax History
| Year | Tax Paid | Tax Assessment Tax Assessment Total Assessment is a certain percentage of the fair market value that is determined by local assessors to be the total taxable value of land and additions on the property. | Land | Improvement |
|---|---|---|---|---|
| 2025 | $5,708 | $399,203 | $97,567 | $301,636 |
| 2023 | $5,618 | $383,703 | $93,779 | $289,924 |
| 2022 | $5,276 | $376,181 | $91,941 | $284,240 |
| 2021 | $5,161 | $368,806 | $90,139 | $278,667 |
| 2020 | $5,126 | $365,025 | $89,215 | $275,810 |
| 2019 | $4,638 | $325,000 | $70,000 | $255,000 |
| 2018 | $4,214 | $290,700 | $71,400 | $219,300 |
| 2017 | $4,112 | $285,000 | $70,000 | $215,000 |
| 2016 | $3,607 | $270,000 | $70,000 | $200,000 |
| 2015 | $3,878 | $285,000 | $55,000 | $230,000 |
| 2014 | $2,988 | $207,000 | $50,400 | $156,600 |
Source: Public Records
Map
Nearby Homes
- 3817 Dockery Ave
- 3502 Dockery Ave
- 1701 Dinuba Ave Unit 110
- 1405 Huntsman Ave
- 1340 Lewis St
- 3280 Mccall Ave
- 1607 Cooper St
- 3239 Lee St
- 2020 Aspen St
- 2980 Olive St
- 2222 Barbara St
- 2019 Oak St
- 9577 S Del Rey Ave
- 2407 Sarah Cir
- 3654 Thompson Ave
- 2841 C St
- 2850 Mccall Ave Unit A-F
- 9449 S Mccall Ave
- 2221 Floral Ave
- 2606 Hillcrest St
Your Personal Tour Guide
Ask me questions while you tour the home.