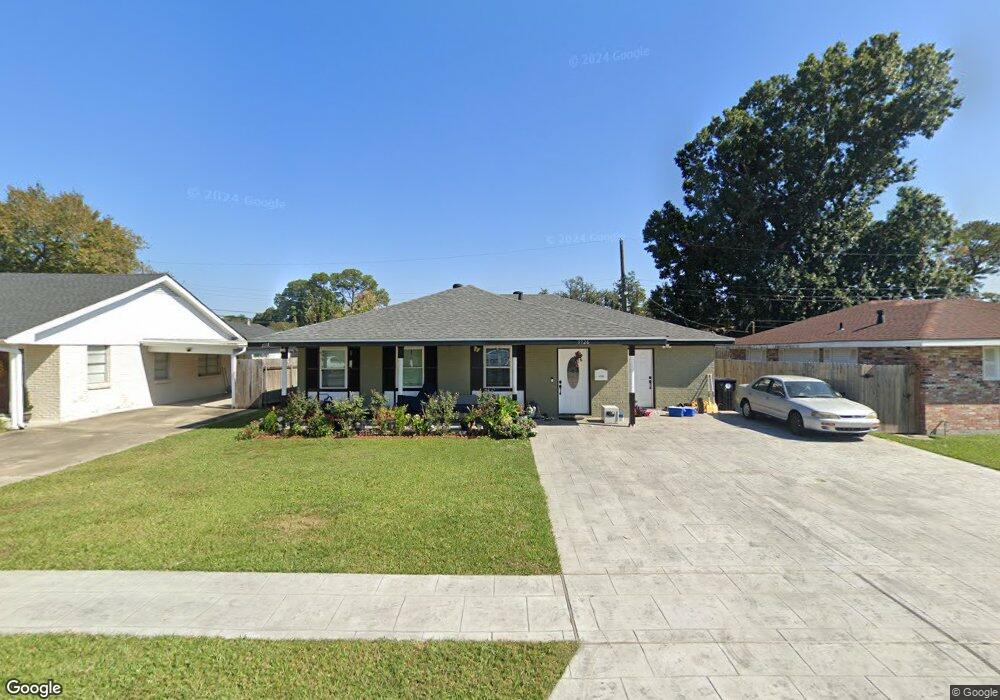
3726 Lang St New Orleans, LA 70131
Old Aurora NeighborhoodEstimated Value: $127,086 - $194,000
3
Beds
2
Baths
1,687
Sq Ft
$101/Sq Ft
Est. Value
About This Home
This home is located at 3726 Lang St, New Orleans, LA 70131 and is currently estimated at $170,772, approximately $101 per square foot. 3726 Lang St is a home located in Orleans Parish with nearby schools including Alice M Harte Elementary Charter School, Dwight D. Eisenhower Charter School, and Paul Habans Charter School.
Ownership History
Date
Name
Owned For
Owner Type
Purchase Details
Closed on
Nov 19, 2021
Sold by
Hight Rodney P
Bought by
Murillo Martha E Delgado and Torres Cesar H
Current Estimated Value
Purchase Details
Closed on
Jan 13, 2006
Sold by
Dessommes Yvonne
Bought by
Mckinzie Lisa
Purchase Details
Closed on
Jul 7, 2003
Sold by
Braning Lisa
Bought by
Preisman Jason
Home Financials for this Owner
Home Financials are based on the most recent Mortgage that was taken out on this home.
Original Mortgage
$114,177
Interest Rate
5.27%
Create a Home Valuation Report for This Property
The Home Valuation Report is an in-depth analysis detailing your home's value as well as a comparison with similar homes in the area
Home Values in the Area
Average Home Value in this Area
Purchase History
| Date | Buyer | Sale Price | Title Company |
|---|---|---|---|
| Murillo Martha E Delgado | $120,000 | Metro Title Group Llc | |
| Mckinzie Lisa | $142,500 | -- | |
| Preisman Jason | $110,000 | -- |
Source: Public Records
Mortgage History
| Date | Status | Borrower | Loan Amount |
|---|---|---|---|
| Previous Owner | Preisman Jason | $114,177 |
Source: Public Records
Tax History Compared to Growth
Tax History
| Year | Tax Paid | Tax Assessment Tax Assessment Total Assessment is a certain percentage of the fair market value that is determined by local assessors to be the total taxable value of land and additions on the property. | Land | Improvement |
|---|---|---|---|---|
| 2025 | $1,426 | $10,800 | $3,600 | $7,200 |
| 2024 | $1,447 | $10,800 | $3,600 | $7,200 |
| 2023 | $1,395 | $10,230 | $2,400 | $7,830 |
| 2022 | $1,395 | $9,840 | $2,400 | $7,440 |
| 2021 | $1,484 | $10,230 | $2,400 | $7,830 |
| 2020 | $1,498 | $10,230 | $2,400 | $7,830 |
| 2019 | $1,789 | $11,820 | $2,400 | $9,420 |
| 2018 | $1,825 | $11,820 | $2,400 | $9,420 |
| 2017 | $1,742 | $11,820 | $2,400 | $9,420 |
| 2016 | $1,817 | $12,470 | $2,400 | $10,070 |
| 2015 | $1,865 | $12,470 | $2,400 | $10,070 |
| 2014 | -- | $12,470 | $2,400 | $10,070 |
| 2013 | -- | $12,470 | $2,400 | $10,070 |
Source: Public Records
Map
Nearby Homes
- 4650 General de Gaulle Dr
- 3436 River Oaks Dr
- 4818 Ken Ct
- 4639 Berkley Dr
- 3511 Hyman Place
- 3401 Huntlee Dr
- 3410 Plymouth Place
- 3326 Somerset Dr
- 32 Yosemite Dr
- 27 Yellowstone Dr
- 83 Yellowstone Dr
- 3228 Somerset Dr
- 28 Grand Canyon Dr
- 3237 Hyman Place
- 3311 Kabel Dr
- 41 Kings Canyon Dr
- 3740 Rue Nichole None
- 25 Grand Canyon Dr
- 3740 Rue Nichole
- 717 River Oaks Dr