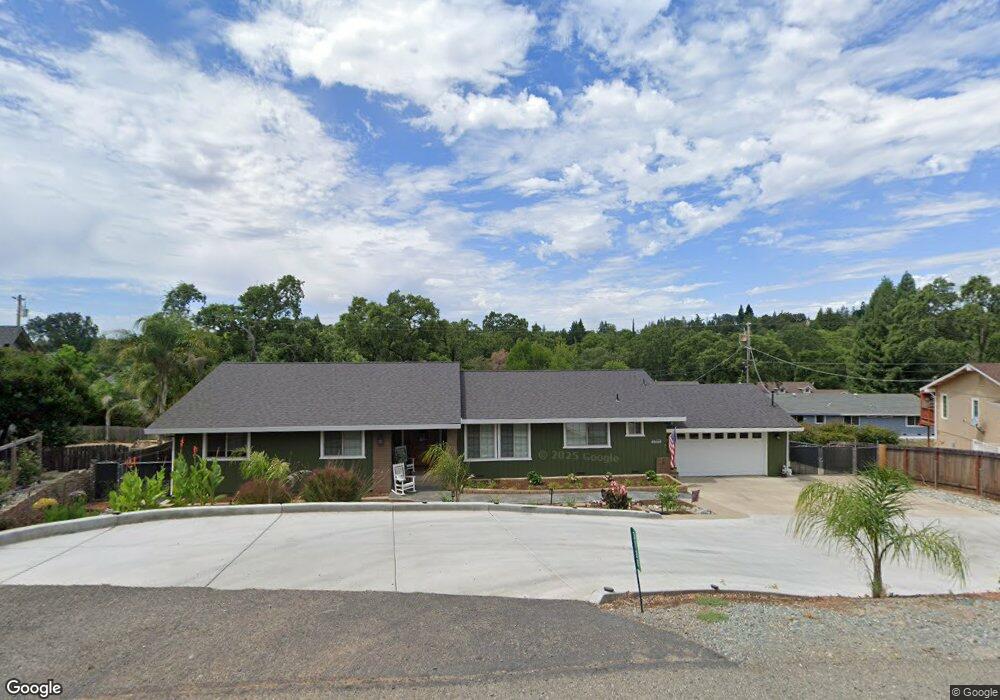
3728 Hampton Ln Cameron Park, CA 95682
Estimated Value: $565,562 - $631,000
3
Beds
2
Baths
2,002
Sq Ft
$301/Sq Ft
Est. Value
About This Home
This home is located at 3728 Hampton Ln, Cameron Park, CA 95682 and is currently estimated at $603,141, approximately $301 per square foot. 3728 Hampton Ln is a home located in El Dorado County with nearby schools including Camerado Springs Middle School, Ponderosa High School, and Buckeye Union Mandarin Immersion Charter School.
Ownership History
Date
Name
Owned For
Owner Type
Purchase Details
Closed on
Feb 22, 2023
Sold by
Latshaw Revocable Trust
Bought by
Kristine Anne Latshaw Living Trust
Current Estimated Value
Purchase Details
Closed on
Feb 1, 2010
Sold by
Latshaw Harold W and Latshaw Mary G
Bought by
Latshaw Harold W and Latshaw Mary G
Purchase Details
Closed on
May 13, 2009
Sold by
Armstrong Kristine A and Latshaw John W
Bought by
Latshaw Harold W and Latshaw Mary G
Purchase Details
Closed on
Oct 3, 2008
Sold by
Latshaw Harold W and Latshaw Trust
Bought by
Armstrong Kristine A and Latshaw John W
Purchase Details
Closed on
Sep 23, 2008
Sold by
Latshaw Mary G and Latshaw Trust
Bought by
Latshaw Harold W and Latshaw Trust
Purchase Details
Closed on
Jul 27, 1999
Sold by
Latshaw Harold W and Latshaw Mary G
Bought by
Latshaw Harold W and Latshaw Mary G
Create a Home Valuation Report for This Property
The Home Valuation Report is an in-depth analysis detailing your home's value as well as a comparison with similar homes in the area
Home Values in the Area
Average Home Value in this Area
Purchase History
| Date | Buyer | Sale Price | Title Company |
|---|---|---|---|
| Kristine Anne Latshaw Living Trust | -- | -- | |
| Latshaw Harold W | -- | None Available | |
| Latshaw Harold W | -- | None Available | |
| Armstrong Kristine A | -- | None Available | |
| Latshaw Harold W | -- | None Available | |
| Latshaw Harold W | -- | -- |
Source: Public Records
Tax History
| Year | Tax Paid | Tax Assessment Tax Assessment Total Assessment is a certain percentage of the fair market value that is determined by local assessors to be the total taxable value of land and additions on the property. | Land | Improvement |
|---|---|---|---|---|
| 2025 | $1,695 | $185,308 | $13,771 | $171,537 |
| 2024 | $1,695 | $158,175 | $13,501 | $144,674 |
| 2023 | $1,663 | $155,075 | $13,237 | $141,838 |
| 2022 | $1,638 | $152,035 | $12,978 | $139,057 |
| 2021 | $1,617 | $149,055 | $12,724 | $136,331 |
| 2020 | $1,595 | $147,528 | $12,594 | $134,934 |
| 2019 | $1,568 | $144,637 | $12,348 | $132,289 |
| 2018 | $1,527 | $141,802 | $12,106 | $129,696 |
| 2017 | $1,494 | $139,022 | $11,869 | $127,153 |
| 2016 | $1,476 | $136,297 | $11,637 | $124,660 |
| 2015 | $1,432 | $134,252 | $11,463 | $122,789 |
| 2014 | $1,432 | $131,625 | $11,240 | $120,385 |
Source: Public Records
Map
Nearby Homes
- 3691 Hampton Ln
- 3831 Sheridan Rd
- 3708 Millbrae Rd
- 3098 Oakwood Rd
- 2406 Knollwood Dr
- 2779 Osborne Rd
- 2886 Knollwood Dr
- 2575 Meadow Ln Unit 8
- 3002 Tri Ln
- 2780 Holly Hills Ln
- 2515 Merrychase Dr Unit K
- 2515 Merrychase Dr Unit F
- 3060 Knollwood Dr
- 3569 Cambridge Rd
- 3590 Montclair Rd
- 7137 Cinnamon Teal Way
- 3341 Rancho Tierra Ct
- 3300 Woodleigh Ln
- 3937 Rustic Rd
- 3788 Hillsborough Rd
- 3720 Hampton Ln
- 3732 Hampton Ln
- 3715 Chelsea Rd
- 3723 Chelsea Rd
- 3731 Hampton Ln
- 3705 Chelsea Rd
- 3738 Hampton Ln
- 3714 Hampton Ln
- 3729 Chelsea Rd
- 3719 Hampton Ln
- 3697 Chelsea Rd
- 3708 Kimberly Rd
- 3724 Kimberly Rd
- 3737 Chelsea Rd
- 3706 Hampton Ln
- 3715 Hampton Ln
- 3734 Kimberly Rd
- 3712 Chelsea Rd
- 3720 Chelsea Rd
- 3700 Kimberly Rd
Your Personal Tour Guide
Ask me questions while you tour the home.