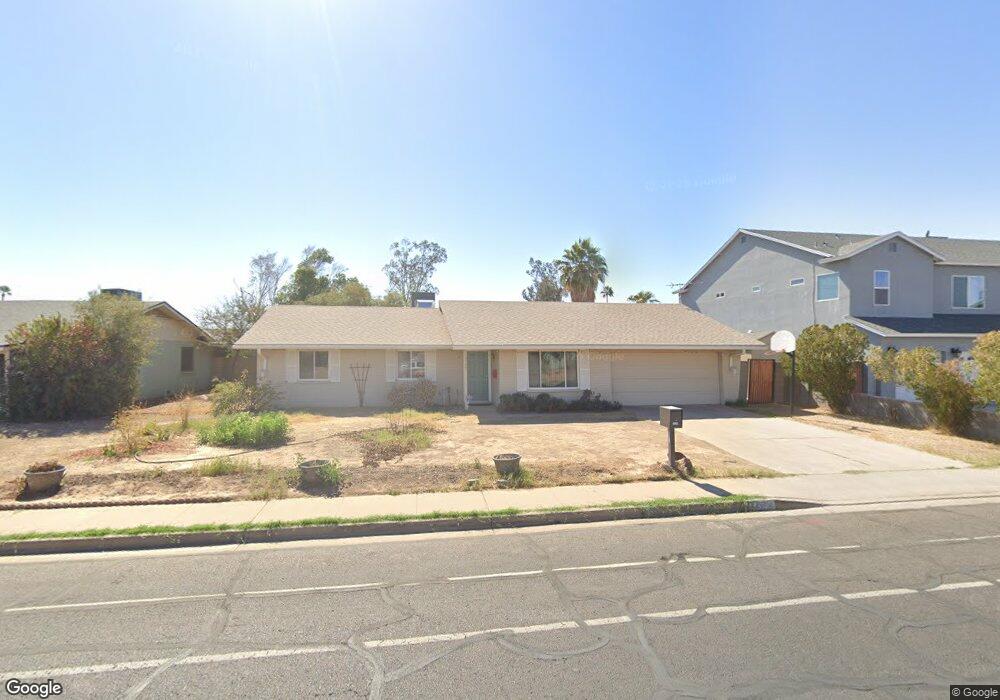
3729 W Cholla St Phoenix, AZ 85029
North Mountain Village NeighborhoodEstimated Value: $369,619 - $409,000
Studio
2
Baths
1,654
Sq Ft
$235/Sq Ft
Est. Value
About This Home
This home is located at 3729 W Cholla St, Phoenix, AZ 85029 and is currently estimated at $389,405, approximately $235 per square foot. 3729 W Cholla St is a home located in Maricopa County with nearby schools including Tumbleweed Elementary School, Cholla Middle School, and Moon Valley High School.
Ownership History
Date
Name
Owned For
Owner Type
Purchase Details
Closed on
Aug 15, 2013
Sold by
Damron Nicole J and Nelson Nicole
Bought by
Damron Nicole J and Damron Jonathan G
Current Estimated Value
Home Financials for this Owner
Home Financials are based on the most recent Mortgage that was taken out on this home.
Original Mortgage
$221,272
Outstanding Balance
$163,827
Interest Rate
4.28%
Mortgage Type
New Conventional
Estimated Equity
$225,578
Purchase Details
Closed on
Jul 21, 2006
Sold by
Zomok Charles J and Zomok Marci S
Bought by
Nelson Nicole
Home Financials for this Owner
Home Financials are based on the most recent Mortgage that was taken out on this home.
Original Mortgage
$251,715
Interest Rate
6.7%
Mortgage Type
New Conventional
Purchase Details
Closed on
Oct 15, 2002
Sold by
Zomok Marci S and Cook Marci S
Bought by
Zomok Charles J and Zomok Marci S
Home Financials for this Owner
Home Financials are based on the most recent Mortgage that was taken out on this home.
Original Mortgage
$65,500
Interest Rate
6.09%
Create a Home Valuation Report for This Property
The Home Valuation Report is an in-depth analysis detailing your home's value as well as a comparison with similar homes in the area
Home Values in the Area
Average Home Value in this Area
Purchase History
| Date | Buyer | Sale Price | Title Company |
|---|---|---|---|
| Damron Nicole J | -- | None Available | |
| Nelson Nicole | $259,500 | Westland Title Agency Of Az | |
| Zomok Charles J | -- | Lawyers Title Of Arizona Inc |
Source: Public Records
Mortgage History
| Date | Status | Borrower | Loan Amount |
|---|---|---|---|
| Open | Damron Nicole J | $221,272 | |
| Closed | Nelson Nicole | $251,715 | |
| Previous Owner | Zomok Charles J | $65,500 |
Source: Public Records
Tax History
| Year | Tax Paid | Tax Assessment Tax Assessment Total Assessment is a certain percentage of the fair market value that is determined by local assessors to be the total taxable value of land and additions on the property. | Land | Improvement |
|---|---|---|---|---|
| 2025 | $1,233 | $11,063 | -- | -- |
| 2024 | $1,162 | $10,536 | -- | -- |
| 2023 | $1,162 | $27,620 | $5,520 | $22,100 |
| 2022 | $1,121 | $21,210 | $4,240 | $16,970 |
| 2021 | $1,150 | $19,470 | $3,890 | $15,580 |
| 2020 | $1,119 | $18,150 | $3,630 | $14,520 |
| 2019 | $1,098 | $16,110 | $3,220 | $12,890 |
| 2018 | $1,067 | $14,930 | $2,980 | $11,950 |
| 2017 | $1,064 | $13,020 | $2,600 | $10,420 |
| 2016 | $1,045 | $12,280 | $2,450 | $9,830 |
| 2015 | $969 | $12,060 | $2,410 | $9,650 |
Source: Public Records
Map
Nearby Homes
- 3654 W Shangri la Rd
- 3824 W Shangri la Rd
- 3736 W Mercer Ln
- 11430 N 37th Ave
- 3840 W Sierra St
- 11002 N 39th Ave
- 3802 W Sahuaro Dr
- 3743 W Sahuaro Dr
- 3939 W Cholla St
- 3741 W Poinsettia Dr
- 10802 N 39th Ave
- 3438 W Sierra St
- 11022 N 41st Ave
- 10219 N 39th Dr
- 4107 W Poinsettia Dr
- 4209 W Yucca St
- 3937 W Paradise Dr
- 10854 N 42nd Ave Unit 2
- 11417 N 33rd Ave
- 4162 W Sierra St
- 3735 W Cholla St Unit 227
- 3735 W Cholla St
- 3723 W Cholla St
- 11220 N 37th Dr
- 3717 W Cholla St
- 3743 W Cholla St
- 3736 W Cholla St
- 3728 W Cholla St
- 11221 N 37th Dr
- 11223 N 38th Ave
- 11212 N 37th Dr
- 3722 W Cholla St
- 3744 W Cholla St Unit 4
- 3711 W Cholla St
- 3716 W Cholla St
- 3750 W Cholla St
- 11215 N 38th Ave
- 11206 N 37th Dr
- 3801 W Cholla St
- 3727 W Lupine Ave
Your Personal Tour Guide
Ask me questions while you tour the home.