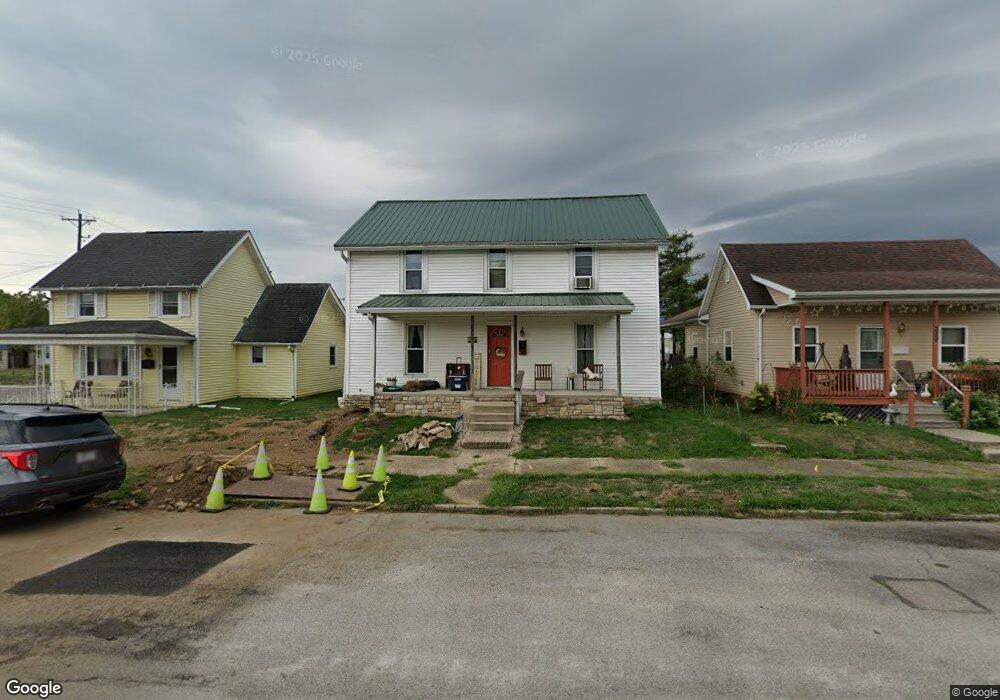
373 E Union St Circleville, OH 43113
Estimated Value: $179,650 - $242,000
4
Beds
2
Baths
1,858
Sq Ft
$112/Sq Ft
Est. Value
About This Home
This home is located at 373 E Union St, Circleville, OH 43113 and is currently estimated at $207,413, approximately $111 per square foot. 373 E Union St is a home located in Pickaway County with nearby schools including Circleville High School and Crossroads Christian Academy.
Ownership History
Date
Name
Owned For
Owner Type
Purchase Details
Closed on
Oct 13, 2023
Sold by
Gantner Michael J and Gantner Melissa Y
Bought by
Gantner Michael J and Gantner Melissa Y
Current Estimated Value
Home Financials for this Owner
Home Financials are based on the most recent Mortgage that was taken out on this home.
Original Mortgage
$99,000
Outstanding Balance
$89,175
Interest Rate
6.51%
Mortgage Type
Credit Line Revolving
Estimated Equity
$118,238
Purchase Details
Closed on
Oct 14, 1993
Sold by
Bryant Ruth L
Bought by
Gantner Michael J
Create a Home Valuation Report for This Property
The Home Valuation Report is an in-depth analysis detailing your home's value as well as a comparison with similar homes in the area
Home Values in the Area
Average Home Value in this Area
Purchase History
| Date | Buyer | Sale Price | Title Company |
|---|---|---|---|
| Gantner Michael J | -- | None Listed On Document | |
| Gantner Michael J | -- | None Listed On Document | |
| Gantner Michael J | $61,000 | -- |
Source: Public Records
Mortgage History
| Date | Status | Borrower | Loan Amount |
|---|---|---|---|
| Open | Gantner Michael J | $99,000 | |
| Closed | Gantner Michael J | $99,000 |
Source: Public Records
Tax History
| Year | Tax Paid | Tax Assessment Tax Assessment Total Assessment is a certain percentage of the fair market value that is determined by local assessors to be the total taxable value of land and additions on the property. | Land | Improvement |
|---|---|---|---|---|
| 2025 | $3,436 | $45,360 | $6,800 | $38,560 |
| 2024 | $3,436 | $45,360 | $6,800 | $38,560 |
| 2023 | $1,032 | $45,360 | $6,800 | $38,560 |
| 2022 | $1,588 | $35,990 | $5,690 | $30,300 |
| 2021 | $1,599 | $35,990 | $5,690 | $30,300 |
| 2020 | $1,598 | $35,990 | $5,690 | $30,300 |
| 2019 | $1,384 | $29,460 | $5,690 | $23,770 |
| 2018 | $1,437 | $29,460 | $5,690 | $23,770 |
| 2017 | $2,337 | $29,460 | $5,690 | $23,770 |
| 2016 | $1,351 | $27,490 | $6,220 | $21,270 |
| 2015 | $1,353 | $27,490 | $6,220 | $21,270 |
| 2014 | $1,348 | $27,490 | $6,220 | $21,270 |
| 2013 | $1,475 | $29,620 | $6,220 | $23,400 |
Source: Public Records
Map
Nearby Homes
- 575 Renick Ave
- 378 E Franklin St
- 446 E Franklin St
- 321 S Pickaway St
- 405 Watt St
- 531 E Franklin St
- 461 Watt St
- 551 E Main St
- 125 N Pickaway St
- 837 Clinton St
- 430 Ruth Ave
- 416 Stella Ave
- 0 Ohio 56 Unit 226002334
- 348 Walnut St
- 339 Walnut St
- 231 Westwood Dr
- 157 W High St
- 1002 S Court St
- 209 Huston St
- 180 Nicholas Dr
Your Personal Tour Guide
Ask me questions while you tour the home.