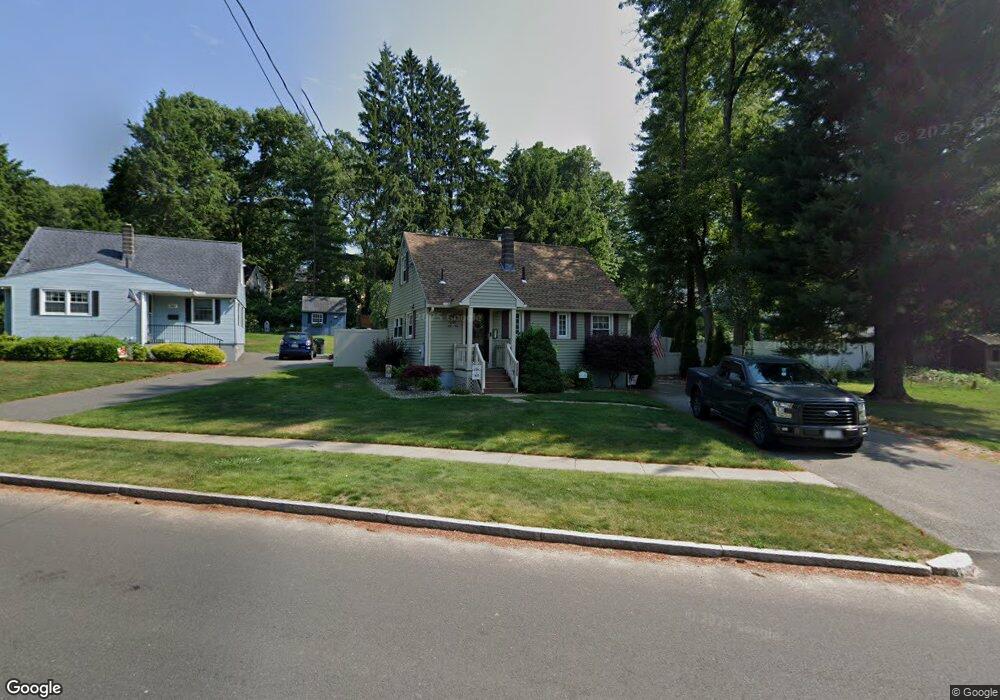
373 Gifford St Springfield, MA 01118
East Forest Park NeighborhoodEstimated Value: $278,000 - $296,000
3
Beds
1
Bath
1,013
Sq Ft
$283/Sq Ft
Est. Value
About This Home
This home is located at 373 Gifford St, Springfield, MA 01118 and is currently estimated at $286,183, approximately $282 per square foot. 373 Gifford St is a home located in Hampden County with nearby schools including Frederick Harris Elementary School, M Marcus Kiley Middle, and Springfield High School of Science and Technology.
Ownership History
Date
Name
Owned For
Owner Type
Purchase Details
Closed on
Jan 13, 2016
Sold by
Marchese Rosemarie
Bought by
Marchese John L and Marchese Rosemarie
Current Estimated Value
Purchase Details
Closed on
Mar 9, 2007
Sold by
Marchese Rosemarie
Bought by
Marchese John L and Marchese Rosemarie
Purchase Details
Closed on
May 29, 1992
Sold by
Fett Edwin A and Fett Madeline I
Bought by
Bruno Rosemary
Home Financials for this Owner
Home Financials are based on the most recent Mortgage that was taken out on this home.
Original Mortgage
$65,000
Interest Rate
8.7%
Mortgage Type
Purchase Money Mortgage
Purchase Details
Closed on
Jun 20, 1991
Sold by
Fett Harry S and Fett Peter A
Bought by
Fett Edwin A and Fett Madeline I
Create a Home Valuation Report for This Property
The Home Valuation Report is an in-depth analysis detailing your home's value as well as a comparison with similar homes in the area
Home Values in the Area
Average Home Value in this Area
Purchase History
| Date | Buyer | Sale Price | Title Company |
|---|---|---|---|
| Marchese John L | -- | -- | |
| Marchese Rosemarie | -- | -- | |
| Marchese John L | -- | -- | |
| Bruno Rosemary | $82,000 | -- | |
| Fett Edwin A | $56,929 | -- |
Source: Public Records
Mortgage History
| Date | Status | Borrower | Loan Amount |
|---|---|---|---|
| Previous Owner | Fett Edwin A | $65,000 |
Source: Public Records
Tax History Compared to Growth
Tax History
| Year | Tax Paid | Tax Assessment Tax Assessment Total Assessment is a certain percentage of the fair market value that is determined by local assessors to be the total taxable value of land and additions on the property. | Land | Improvement |
|---|---|---|---|---|
| 2025 | $3,679 | $234,600 | $48,200 | $186,400 |
| 2024 | $3,678 | $229,000 | $48,200 | $180,800 |
| 2023 | $3,135 | $183,900 | $45,900 | $138,000 |
| 2022 | $3,269 | $173,700 | $45,900 | $127,800 |
| 2021 | $3,137 | $166,000 | $41,800 | $124,200 |
| 2020 | $2,775 | $142,100 | $41,800 | $100,300 |
| 2019 | $2,749 | $139,700 | $41,800 | $97,900 |
| 2018 | $2,793 | $141,900 | $41,800 | $100,100 |
| 2017 | $2,689 | $136,800 | $41,800 | $95,000 |
| 2016 | $2,597 | $132,100 | $41,800 | $90,300 |
| 2015 | $2,620 | $133,200 | $41,800 | $91,400 |
Source: Public Records
Map
Nearby Homes
- 392 Gifford St
- 157 Canterbury Rd
- 77 W Allen Ridge Rd
- 125 Manor Ct Unit 125
- 56 Hadley St
- 19 Manor Ct Unit 19
- 5 Manor Ct Unit 5
- 26 Harkness Ave
- 155 Powell Ave
- 261 W Allen Ridge Rd
- 206 Treetop Ave
- 43 Sunridge Dr
- 36 Garland St
- 55 Allen St
- 80 Tulsa St
- 95 Benz St
- 100 Abbott St
- 54 Shady Brook Ln
- 17 Pebble Mill Rd
- 196 Sawmill Rd
- 381 Gifford St
- 117 E Allen Ridge Rd
- 105 E Allen Ridge Rd
- 387 Gifford St
- 0 Gifford St
- 134 Canterbury Rd
- 378 Gifford St
- 128 Canterbury Rd
- 125 E Allen Ridge Rd
- 140 Canterbury Rd
- 120 Canterbury Rd
- 91 E Allen Ridge Rd
- 148 Canterbury Rd
- 135 E Allen Ridge Rd
- 14 Amos Dr
- 400 Gifford St
- 108 E Allen Ridge Rd
- 154 Canterbury Rd
- 83 E Allen Ridge Rd
- 118 E Allen Ridge Rd