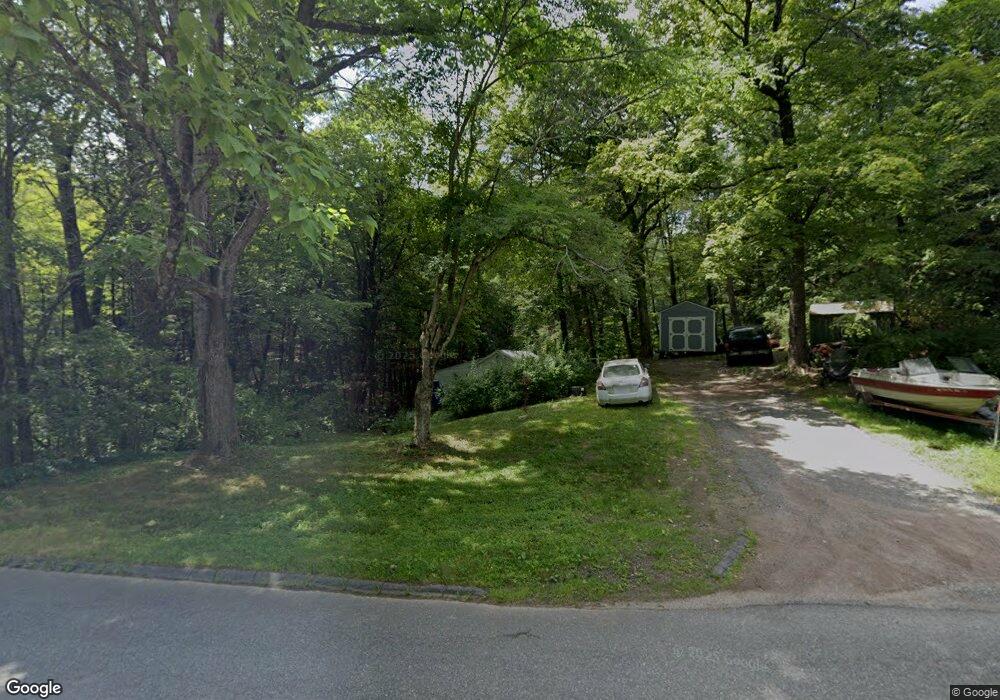
373 Upper Rd Deerfield, MA 01342
Estimated Value: $146,000 - $409,000
2
Beds
1
Bath
614
Sq Ft
$386/Sq Ft
Est. Value
About This Home
This home is located at 373 Upper Rd, Deerfield, MA 01342 and is currently estimated at $237,142, approximately $386 per square foot. 373 Upper Rd is a home located in Franklin County with nearby schools including Deerfield Elementary School, Frontier Regional School, and Four Rivers Charter Public School.
Ownership History
Date
Name
Owned For
Owner Type
Purchase Details
Closed on
Sep 4, 1998
Sold by
Upper Rd T and Brooks David C
Bought by
Rush Doyle D
Current Estimated Value
Purchase Details
Closed on
Aug 19, 1998
Sold by
Otto Robert R and Denison Alma R
Bought by
Upper Road Trust and Brooks David C
Create a Home Valuation Report for This Property
The Home Valuation Report is an in-depth analysis detailing your home's value as well as a comparison with similar homes in the area
Home Values in the Area
Average Home Value in this Area
Purchase History
| Date | Buyer | Sale Price | Title Company |
|---|---|---|---|
| Rush Doyle D | $38,000 | -- | |
| Upper Road Trust | $10,000 | -- |
Source: Public Records
Mortgage History
| Date | Status | Borrower | Loan Amount |
|---|---|---|---|
| Open | Upper Road Trust | $80,000 | |
| Closed | Upper Road Trust | $66,000 | |
| Closed | Upper Road Trust | $10,650 | |
| Closed | Upper Road Trust | $50,000 |
Source: Public Records
Tax History Compared to Growth
Tax History
| Year | Tax Paid | Tax Assessment Tax Assessment Total Assessment is a certain percentage of the fair market value that is determined by local assessors to be the total taxable value of land and additions on the property. | Land | Improvement |
|---|---|---|---|---|
| 2025 | $2,410 | $181,900 | $100,700 | $81,200 |
| 2024 | $2,320 | $167,500 | $91,600 | $75,900 |
| 2023 | $1,978 | $132,100 | $71,700 | $60,400 |
| 2022 | $1,966 | $129,600 | $71,700 | $57,900 |
| 2021 | $4,322 | $128,800 | $71,700 | $57,100 |
| 2020 | $2,021 | $128,800 | $71,700 | $57,100 |
| 2019 | $2,011 | $126,400 | $71,700 | $54,700 |
| 2018 | $1,971 | $123,600 | $68,700 | $54,900 |
| 2017 | $4,322 | $123,600 | $68,700 | $54,900 |
| 2016 | $1,763 | $115,600 | $65,600 | $50,000 |
| 2015 | $1,727 | $115,600 | $65,600 | $50,000 |
Source: Public Records
Map
Nearby Homes