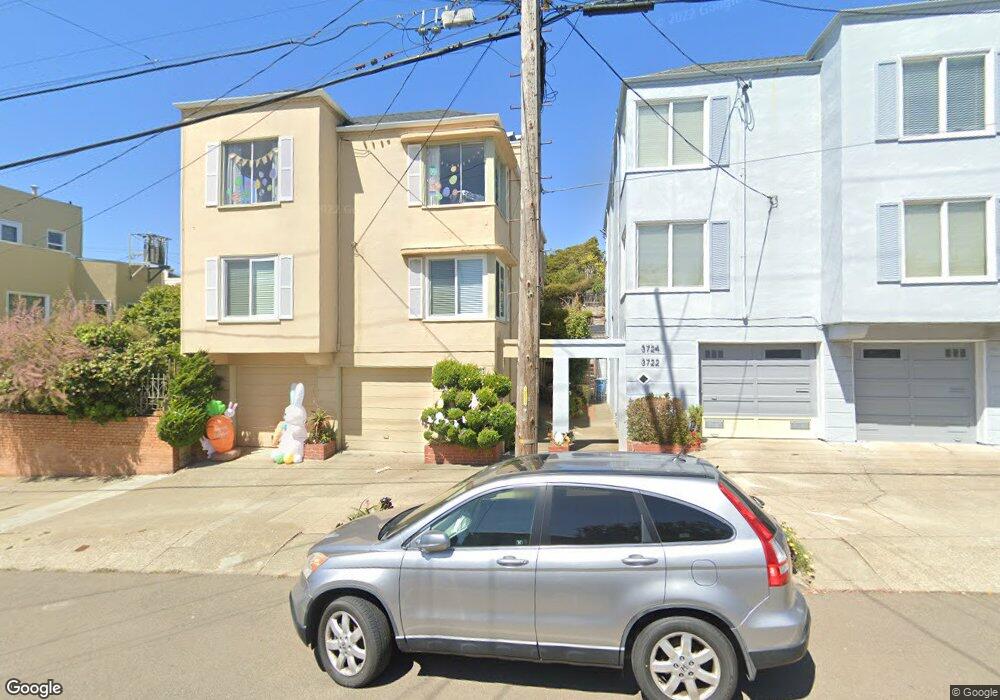
3730 Cabrillo St Unit 3732 San Francisco, CA 94121
Outer Richmond NeighborhoodEstimated Value: $1,464,000 - $2,140,000
4
Beds
2
Baths
2,300
Sq Ft
$768/Sq Ft
Est. Value
About This Home
This home is located at 3730 Cabrillo St Unit 3732, San Francisco, CA 94121 and is currently estimated at $1,767,318, approximately $768 per square foot. 3730 Cabrillo St Unit 3732 is a home located in San Francisco County with nearby schools including Lafayette Elementary School, Presidio Middle School, and St. Thomas The Apostle School.
Ownership History
Date
Name
Owned For
Owner Type
Purchase Details
Closed on
Jul 16, 2015
Sold by
Forcum Mark and Forcum Julie
Bought by
Forcum Llc
Current Estimated Value
Purchase Details
Closed on
Jun 1, 2013
Sold by
Gmjk Llc
Bought by
Forcum Ernestine Juanita and Forcum Mark
Purchase Details
Closed on
Sep 21, 2005
Sold by
Forcum Richard Glenn and Forcum James Klaa
Bought by
Gmjk Llc
Create a Home Valuation Report for This Property
The Home Valuation Report is an in-depth analysis detailing your home's value as well as a comparison with similar homes in the area
Home Values in the Area
Average Home Value in this Area
Purchase History
| Date | Buyer | Sale Price | Title Company |
|---|---|---|---|
| Forcum Llc | -- | None Available | |
| Forcum Mark | -- | None Available | |
| Forcum Ernestine Juanita | -- | None Available | |
| Gmjk Llc | -- | -- | |
| Forcum Richard Glenn | -- | -- |
Source: Public Records
Tax History Compared to Growth
Tax History
| Year | Tax Paid | Tax Assessment Tax Assessment Total Assessment is a certain percentage of the fair market value that is determined by local assessors to be the total taxable value of land and additions on the property. | Land | Improvement |
|---|---|---|---|---|
| 2025 | $3,548 | $221,573 | $110,061 | $111,512 |
| 2024 | $3,548 | $217,229 | $107,903 | $109,326 |
| 2023 | $3,394 | $212,971 | $105,788 | $107,183 |
| 2022 | $3,300 | $208,796 | $103,714 | $105,082 |
| 2021 | $3,238 | $204,703 | $101,681 | $103,022 |
| 2020 | $3,372 | $202,605 | $100,639 | $101,966 |
| 2019 | $3,169 | $198,633 | $98,666 | $99,967 |
| 2018 | $3,067 | $194,739 | $96,732 | $98,007 |
| 2017 | $2,734 | $190,922 | $94,836 | $96,086 |
| 2016 | $2,662 | $187,072 | $92,921 | $94,151 |
| 2015 | $2,628 | $184,268 | $91,529 | $92,739 |
| 2014 | $2,564 | $180,663 | $89,739 | $90,924 |
Source: Public Records
Map
Nearby Homes