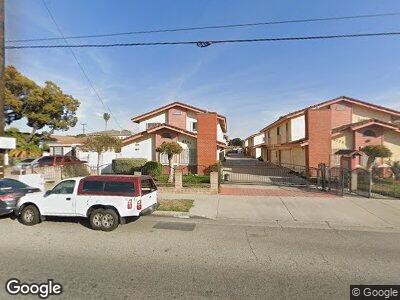
3730 Cogswell Rd Unit F El Monte, CA 91732
River East NeighborhoodEstimated Value: $567,000 - $645,000
3
Beds
3
Baths
1,253
Sq Ft
$488/Sq Ft
Est. Value
About This Home
This home is located at 3730 Cogswell Rd Unit F, El Monte, CA 91732 and is currently estimated at $611,411, approximately $487 per square foot. 3730 Cogswell Rd Unit F is a home located in Los Angeles County with nearby schools including Mountain View High.
Ownership History
Date
Name
Owned For
Owner Type
Purchase Details
Closed on
Oct 14, 2011
Sold by
Twj Enterprises Inc Retirement Account
Bought by
Ngo Hanh My
Current Estimated Value
Home Financials for this Owner
Home Financials are based on the most recent Mortgage that was taken out on this home.
Original Mortgage
$235,000
Interest Rate
4.05%
Mortgage Type
New Conventional
Purchase Details
Closed on
Jun 22, 2011
Sold by
Ngo Dung Hoc and Chi Jennifer
Bought by
Twj Enterprises Inc Retirement Account
Purchase Details
Closed on
May 4, 2006
Sold by
Lee Christine T and Lee Phuong T
Bought by
Ngo Dung Hoc and Chi Jennifer
Home Financials for this Owner
Home Financials are based on the most recent Mortgage that was taken out on this home.
Original Mortgage
$13,000
Interest Rate
6.63%
Mortgage Type
Credit Line Revolving
Create a Home Valuation Report for This Property
The Home Valuation Report is an in-depth analysis detailing your home's value as well as a comparison with similar homes in the area
Home Values in the Area
Average Home Value in this Area
Purchase History
| Date | Buyer | Sale Price | Title Company |
|---|---|---|---|
| Ngo Hanh My | $255,000 | Advantage Title Inc | |
| Twj Enterprises Inc Retirement Account | -- | None Available | |
| Ngo Dung Hoc | $399,000 | Ticor Title Company |
Source: Public Records
Mortgage History
| Date | Status | Borrower | Loan Amount |
|---|---|---|---|
| Open | Ngo Hanh My | $200,000 | |
| Closed | Ngo Hanh My | $223,000 | |
| Closed | Ngo Hanh My | $235,000 | |
| Previous Owner | Chi Jennifer | $13,000 | |
| Previous Owner | Ngo Dung Hoc | $304,000 | |
| Previous Owner | Lee Christine T | $142,500 |
Source: Public Records
Tax History Compared to Growth
Tax History
| Year | Tax Paid | Tax Assessment Tax Assessment Total Assessment is a certain percentage of the fair market value that is determined by local assessors to be the total taxable value of land and additions on the property. | Land | Improvement |
|---|---|---|---|---|
| 2024 | $4,429 | $314,001 | $140,129 | $173,872 |
| 2023 | $4,354 | $307,845 | $137,382 | $170,463 |
| 2022 | $4,186 | $301,810 | $134,689 | $167,121 |
| 2021 | $4,283 | $295,894 | $132,049 | $163,845 |
| 2019 | $4,149 | $287,119 | $128,133 | $158,986 |
| 2018 | $3,984 | $281,490 | $125,621 | $155,869 |
| 2016 | $3,667 | $270,561 | $120,744 | $149,817 |
| 2015 | $3,626 | $266,498 | $118,931 | $147,567 |
| 2014 | $3,550 | $261,279 | $116,602 | $144,677 |
Source: Public Records
Map
Nearby Homes
- 3920 Cogswell Rd
- 4003 Penn Mar Ave Unit 6
- 11843 Ramona Blvd
- 3528 La Madera Ave
- 3512 La Madera Ave
- 3861 Durfee Ave
- 3441 Cogswell Rd Unit B
- 11745 Sitka St Unit B
- 2720 2724 Durfee Ave
- 12145 Wanda St
- 11713 Sitka St
- 3840 Durfee Ave
- 11865 Exline St Unit B
- 12210 Kerrwood St Unit B
- 11670 Ferris Rd
- 12139 Ramona Blvd
- 11834 Kerrwood St
- 3855 Gilman Rd
- 3903 Gilman Rd
- 11825 Basye St
- 3728 Cogswell Rd Unit A
- 3728 Cogswell Rd Unit B
- 3728 Cogswell Rd Unit C
- 3728 Cogswell Rd Unit D
- 3728 Cogswell Rd Unit E
- 3728 Cogswell Rd Unit F
- 3730 Cogswell Rd Unit F
- 3730 Cogswell Rd Unit E
- 3730 Cogswell Rd Unit D
- 3730 Cogswell Rd Unit C
- 3730 Cogswell Rd Unit A
- 0 Aaaa Ave Unit CC37617
- 1 Mall
- 0 - Unit CRAR24252842
- 0 - Unit F1826835
- 3726 Cogswell Rd Unit A
- 3726 Cogswell Rd Unit C
- 3726 Cogswell Rd Unit B
- 3726 Cogswell Rd Unit A
- 12014 Deana St