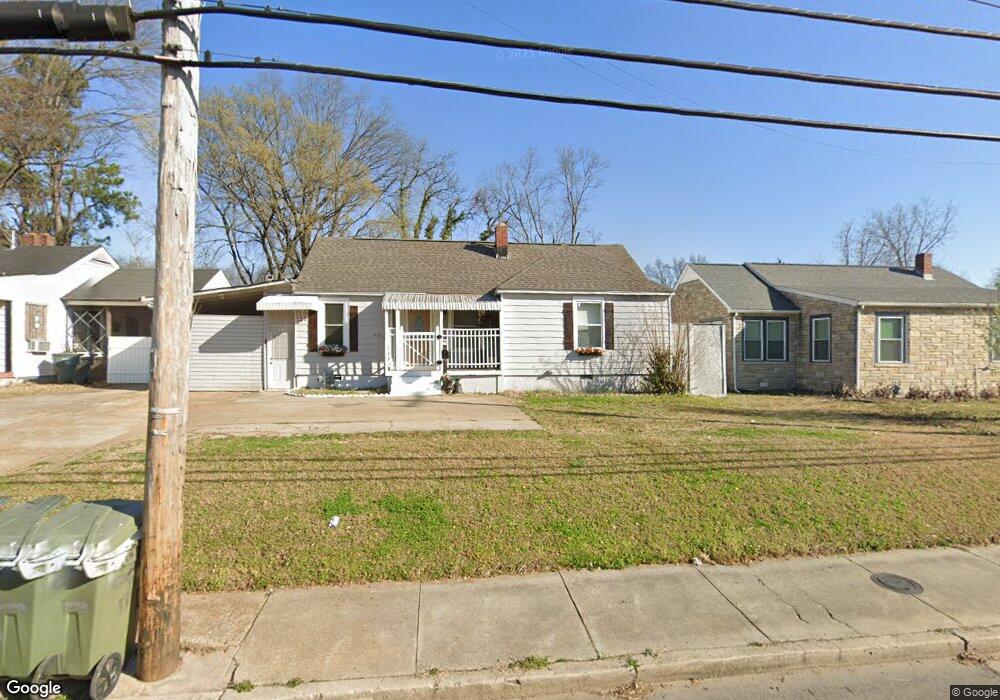
3732 Macon Rd Memphis, TN 38122
Berclair NeighborhoodEstimated Value: $67,000 - $87,423
2
Beds
1
Bath
854
Sq Ft
$92/Sq Ft
Est. Value
About This Home
This home is located at 3732 Macon Rd, Memphis, TN 38122 and is currently estimated at $78,356, approximately $91 per square foot. 3732 Macon Rd is a home located in Shelby County with nearby schools including Kingsbury Elementary School, Kingsbury Middle School, and Kingsbury High School.
Ownership History
Date
Name
Owned For
Owner Type
Purchase Details
Closed on
Oct 1, 2010
Sold by
Fannie Mae
Bought by
Cuadros Clodoalda E
Current Estimated Value
Purchase Details
Closed on
Aug 9, 2010
Sold by
Stark Ed A
Bought by
Federal National Mortgage Association
Purchase Details
Closed on
Nov 11, 1999
Sold by
Teressa Currier
Bought by
Stark Ed A
Home Financials for this Owner
Home Financials are based on the most recent Mortgage that was taken out on this home.
Original Mortgage
$35,055
Interest Rate
7.81%
Purchase Details
Closed on
May 22, 1998
Sold by
Deskin William D and Deskin Barbara J
Bought by
Currier Teressa
Home Financials for this Owner
Home Financials are based on the most recent Mortgage that was taken out on this home.
Original Mortgage
$33,600
Interest Rate
7.15%
Purchase Details
Closed on
Oct 23, 1997
Sold by
Matlock M E and Matlock Joyce H
Bought by
Deskin William D and Deskin Barbara J
Create a Home Valuation Report for This Property
The Home Valuation Report is an in-depth analysis detailing your home's value as well as a comparison with similar homes in the area
Home Values in the Area
Average Home Value in this Area
Purchase History
| Date | Buyer | Sale Price | Title Company |
|---|---|---|---|
| Cuadros Clodoalda E | $9,900 | None Available | |
| Federal National Mortgage Association | $15,727 | None Available | |
| Stark Ed A | $36,900 | -- | |
| Currier Teressa | $42,000 | Transcontinental Title Compa | |
| Deskin William D | $29,000 | -- |
Source: Public Records
Mortgage History
| Date | Status | Borrower | Loan Amount |
|---|---|---|---|
| Previous Owner | Stark Ed A | $35,055 | |
| Previous Owner | Currier Teressa | $33,600 |
Source: Public Records
Tax History Compared to Growth
Tax History
| Year | Tax Paid | Tax Assessment Tax Assessment Total Assessment is a certain percentage of the fair market value that is determined by local assessors to be the total taxable value of land and additions on the property. | Land | Improvement |
|---|---|---|---|---|
| 2025 | $309 | $17,950 | $3,375 | $14,575 |
| 2024 | $309 | $9,125 | $1,325 | $7,800 |
| 2023 | $556 | $9,125 | $1,325 | $7,800 |
| 2022 | $556 | $9,125 | $1,325 | $7,800 |
| 2021 | $562 | $9,125 | $1,325 | $7,800 |
| 2020 | $495 | $6,825 | $1,150 | $5,675 |
| 2019 | $495 | $6,825 | $1,150 | $5,675 |
| 2018 | $495 | $6,825 | $1,150 | $5,675 |
| 2017 | $281 | $6,825 | $1,150 | $5,675 |
| 2016 | $302 | $6,900 | $0 | $0 |
| 2014 | $302 | $6,900 | $0 | $0 |
Source: Public Records
Map
Nearby Homes
- 1023 Dillworth St
- 3789 Fairoaks Ave
- 1059 Maria St
- 1260 Wrenwood St
- 956 Dillworth St
- 1051 Treadwell St Unit 1051/1053
- 1051 Treadwell St
- 1167 Gordon St
- 3698 Given Ave
- 1357 Salem St
- 3981 Grahamdale Cir Unit 3981B
- 1370 Isabelle St
- 3962 Grahamdale Cir Unit 3962A
- 3989 Grahamdale Cir Unit 3989A
- 3967 Grahamdale Cir Unit 3967B
- 3970 Grahamdale Cir Unit 3970A
- 1345 Maria St
- 3738 Townes Ave
- 4037 Graham Oaks Ct Unit 30
- 3570 Mayfair Ave
- 3726 Macon Rd
- 3738 Macon Rd
- 3718 Macon Rd
- 3731 Buchanan Ave
- 3744 Macon Rd
- 3725 Buchanan Ave
- 3737 Buchanan Ave
- 3717 Buchanan Ave
- 3743 Buchanan Ave
- 3712 Macon Rd
- 3750 Macon Rd
- 3711 Buchanan Ave
- 3749 Buchanan Ave
- 3706 Macon Rd
- 3756 Macon Rd
- 3705 Buchanan Ave
- 3755 Buchanan Ave
- 3732 Buchanan Ave
- 3726 Buchanan Ave
- 3738 Buchanan Ave