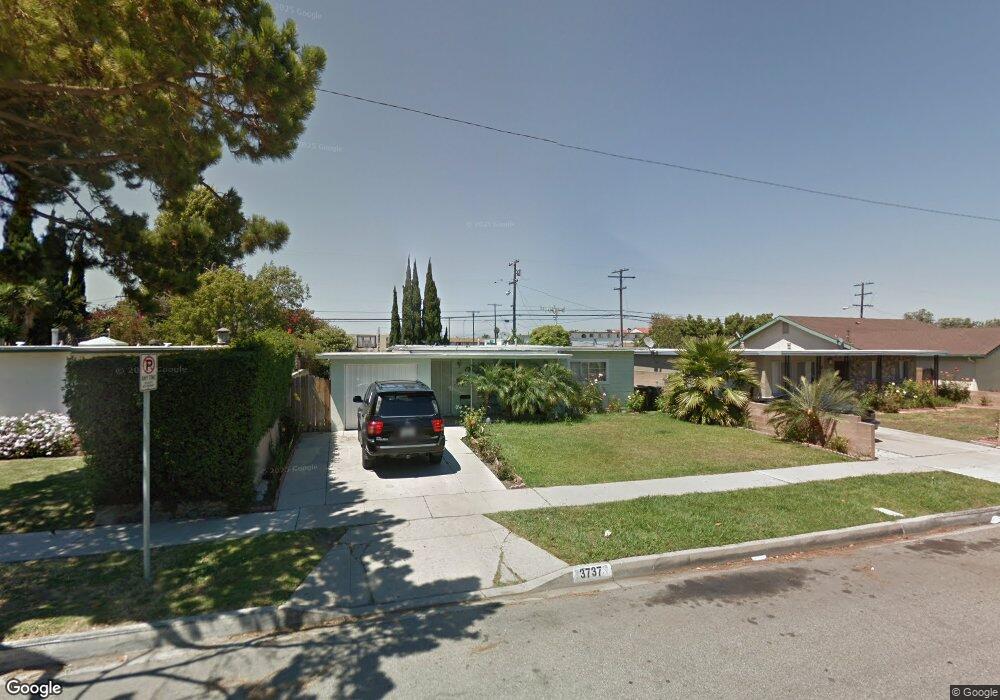
3737 W 144th St Hawthorne, CA 90250
Estimated Value: $799,265 - $856,000
3
Beds
1
Bath
1,141
Sq Ft
$723/Sq Ft
Est. Value
About This Home
This home is located at 3737 W 144th St, Hawthorne, CA 90250 and is currently estimated at $824,816, approximately $722 per square foot. 3737 W 144th St is a home located in Los Angeles County with nearby schools including F.D. Roosevelt Elementary School, Will Rogers Middle School, and Leuzinger High School.
Ownership History
Date
Name
Owned For
Owner Type
Purchase Details
Closed on
Nov 30, 2013
Sold by
Chinchilla Julio
Bought by
Chinchilla Julio and Chinchilla Angelica
Current Estimated Value
Home Financials for this Owner
Home Financials are based on the most recent Mortgage that was taken out on this home.
Original Mortgage
$227,100
Outstanding Balance
$106,813
Interest Rate
4.04%
Mortgage Type
New Conventional
Estimated Equity
$718,003
Purchase Details
Closed on
Mar 21, 2001
Sold by
Chinchilla Angelica
Bought by
Chinchilla Julio
Home Financials for this Owner
Home Financials are based on the most recent Mortgage that was taken out on this home.
Original Mortgage
$185,587
Interest Rate
7.19%
Mortgage Type
FHA
Purchase Details
Closed on
Mar 14, 2001
Sold by
Santen Stephen A and Santen Julie A
Bought by
Chinchilla Julio
Home Financials for this Owner
Home Financials are based on the most recent Mortgage that was taken out on this home.
Original Mortgage
$185,587
Interest Rate
7.19%
Mortgage Type
FHA
Create a Home Valuation Report for This Property
The Home Valuation Report is an in-depth analysis detailing your home's value as well as a comparison with similar homes in the area
Home Values in the Area
Average Home Value in this Area
Purchase History
| Date | Buyer | Sale Price | Title Company |
|---|---|---|---|
| Chinchilla Julio | -- | First American Title Ins Co | |
| Chinchilla Julio | -- | South Coast Title | |
| Chinchilla Julio | $188,500 | South Coast Title Company |
Source: Public Records
Mortgage History
| Date | Status | Borrower | Loan Amount |
|---|---|---|---|
| Open | Chinchilla Julio | $227,100 | |
| Closed | Chinchilla Julio | $185,587 |
Source: Public Records
Tax History Compared to Growth
Tax History
| Year | Tax Paid | Tax Assessment Tax Assessment Total Assessment is a certain percentage of the fair market value that is determined by local assessors to be the total taxable value of land and additions on the property. | Land | Improvement |
|---|---|---|---|---|
| 2025 | $3,846 | $284,017 | $227,221 | $56,796 |
| 2024 | $3,846 | $278,449 | $222,766 | $55,683 |
| 2023 | $3,653 | $272,991 | $218,399 | $54,592 |
| 2022 | $3,652 | $267,639 | $214,117 | $53,522 |
| 2021 | $3,560 | $262,392 | $209,919 | $52,473 |
| 2019 | $3,433 | $254,611 | $203,694 | $50,917 |
| 2018 | $3,341 | $249,619 | $199,700 | $49,919 |
| 2016 | $3,106 | $239,929 | $191,947 | $47,982 |
| 2015 | $3,026 | $236,326 | $189,064 | $47,262 |
| 2014 | $3,010 | $231,698 | $185,361 | $46,337 |
Source: Public Records
Map
Nearby Homes
- 3609 W 144th St
- 14110 Yukon Ave
- 14540 Yukon Ave
- 14725 Kornblum Ave
- 14522 Avis Ave
- 14000 Cerise Ave
- 14012 Cerise Ave Unit 3
- 13945 Lemoli Ave
- 14050 Lemoli Way
- 13534 Cordary Ave Unit 14
- 14026 Lemoli Ave Unit C
- 4120 W 147th St
- 15132 Kornblum Ave
- 3351 Marine Ave
- 14324 Chadron Ave
- 4203 W 141st St
- 3512 W 135th St
- 14526 Chadron Ave
- 13439 Roselle Ave
- 13717 Chadron Ave
- 3743 W 144th St Unit B
- 3743 W 144th St
- 3731 W 144th St
- 3725 W 144th St
- 3749 W 144th St
- 3721 W 144th St
- 3753 W 144th St
- 3734 W 144th St
- 3728 W 144th St
- 3742 W 144th St
- 3722 W 144th St
- 3748 W 144th St
- 3715 W 144th St
- 14310 Doty Ave
- 3739 W Rosecrans Ave
- 3720 W 144th St
- 3756 W 144th St
- 3711 W 144th St
- 3733 W 144th Place
- 3739 W 144th Place