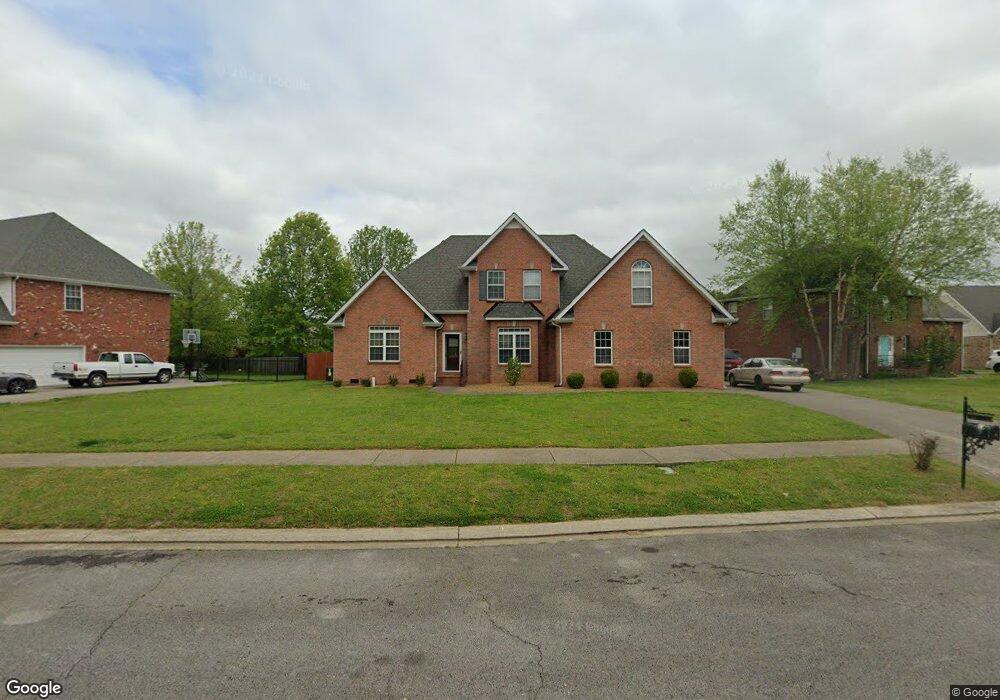
374 Chippen Ct Murfreesboro, TN 37128
Estimated Value: $440,227 - $503,000
3
Beds
3
Baths
2,345
Sq Ft
$204/Sq Ft
Est. Value
About This Home
This home is located at 374 Chippen Ct, Murfreesboro, TN 37128 and is currently estimated at $478,557, approximately $204 per square foot. 374 Chippen Ct is a home located in Rutherford County with nearby schools including Barfield Elementary School, Salem Elementary School, and Christiana Middle School.
Ownership History
Date
Name
Owned For
Owner Type
Purchase Details
Closed on
Oct 2, 2014
Sold by
Biles Michael J
Bought by
Prater Jie He and Ma Ming Hua
Current Estimated Value
Purchase Details
Closed on
Jun 19, 2007
Sold by
Kevin Mcmillan
Bought by
Biles Michael J
Home Financials for this Owner
Home Financials are based on the most recent Mortgage that was taken out on this home.
Original Mortgage
$166,500
Interest Rate
6.35%
Mortgage Type
Purchase Money Mortgage
Purchase Details
Closed on
Aug 5, 2005
Sold by
Mangrum Ronald E
Bought by
Mcmillan and Paige
Home Financials for this Owner
Home Financials are based on the most recent Mortgage that was taken out on this home.
Original Mortgage
$170,850
Interest Rate
5.57%
Mortgage Type
Purchase Money Mortgage
Purchase Details
Closed on
Jan 11, 2001
Sold by
Calcote Company
Bought by
Mangrum Ronald E and Mangrum Lisa
Create a Home Valuation Report for This Property
The Home Valuation Report is an in-depth analysis detailing your home's value as well as a comparison with similar homes in the area
Home Values in the Area
Average Home Value in this Area
Purchase History
| Date | Buyer | Sale Price | Title Company |
|---|---|---|---|
| Prater Jie He | $205,000 | -- | |
| Biles Michael J | $222,000 | -- | |
| Biles Michael J | $222,000 | -- | |
| Mcmillan | $208,000 | -- | |
| Mangrum Ronald E | $173,000 | -- |
Source: Public Records
Mortgage History
| Date | Status | Borrower | Loan Amount |
|---|---|---|---|
| Previous Owner | Biles Michael J | $166,500 | |
| Previous Owner | Biles Michael J | $55,500 | |
| Previous Owner | Mangrum Ronald E | $170,850 |
Source: Public Records
Tax History
| Year | Tax Paid | Tax Assessment Tax Assessment Total Assessment is a certain percentage of the fair market value that is determined by local assessors to be the total taxable value of land and additions on the property. | Land | Improvement |
|---|---|---|---|---|
| 2025 | $2,815 | $99,500 | $13,750 | $85,750 |
| 2024 | $2,815 | $99,500 | $13,750 | $85,750 |
| 2023 | $1,867 | $99,500 | $13,750 | $85,750 |
| 2022 | $1,608 | $99,500 | $13,750 | $85,750 |
| 2021 | $1,549 | $69,775 | $10,625 | $59,150 |
| 2020 | $1,549 | $69,775 | $10,625 | $59,150 |
| 2019 | $1,549 | $69,775 | $10,625 | $59,150 |
| 2018 | $2,127 | $69,775 | $0 | $0 |
| 2017 | $2,111 | $54,325 | $0 | $0 |
| 2016 | $2,111 | $54,325 | $0 | $0 |
| 2015 | $2,111 | $54,325 | $0 | $0 |
| 2014 | $1,351 | $54,325 | $0 | $0 |
| 2013 | -- | $53,200 | $0 | $0 |
Source: Public Records
Map
Nearby Homes
- 369 Chippen Ct
- 284 Meigs Dr Unit N-3
- 3182 Jenkins Dr
- 240 Meigs Dr
- 3236 Prater Ct
- 3164 Prater Ct
- 321 Amherst Dr
- 3028 Prater Ct
- 235 Whiteamore Run
- 306 Whiteamore Run
- 4001 Southridge Blvd
- 106 Daly Dr
- 231 Comer Cir
- 118 Couples Ct
- 754 Veterans Pkwy
- 189 Red Jacket Trace
- 338 Rowlette Cir
- 197 Red Jacket Trace
- 220 Rowlette Cir
- 237 Rowlette Cir
Your Personal Tour Guide
Ask me questions while you tour the home.