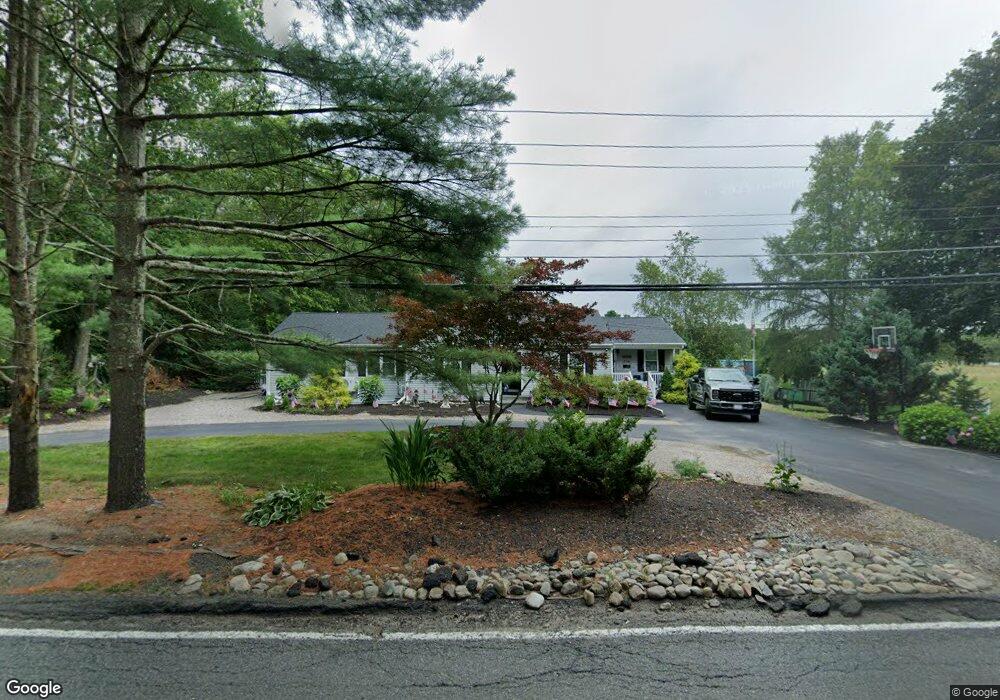
374 East St Sharon, MA 02067
Estimated Value: $620,000 - $849,000
2
Beds
1
Bath
1,100
Sq Ft
$712/Sq Ft
Est. Value
About This Home
This home is located at 374 East St, Sharon, MA 02067 and is currently estimated at $782,839, approximately $711 per square foot. 374 East St is a home located in Norfolk County with nearby schools including East Elementary School, Sharon Middle School, and Sharon High School.
Ownership History
Date
Name
Owned For
Owner Type
Purchase Details
Closed on
Feb 26, 2008
Sold by
Stonegate 2 T
Bought by
Frost Scott A
Current Estimated Value
Home Financials for this Owner
Home Financials are based on the most recent Mortgage that was taken out on this home.
Original Mortgage
$251,060
Interest Rate
5.9%
Mortgage Type
Purchase Money Mortgage
Purchase Details
Closed on
Aug 17, 2007
Sold by
Creeden Kimberly
Bought by
Stonegate T 2
Home Financials for this Owner
Home Financials are based on the most recent Mortgage that was taken out on this home.
Original Mortgage
$210,000
Interest Rate
6.67%
Mortgage Type
Purchase Money Mortgage
Create a Home Valuation Report for This Property
The Home Valuation Report is an in-depth analysis detailing your home's value as well as a comparison with similar homes in the area
Home Values in the Area
Average Home Value in this Area
Purchase History
| Date | Buyer | Sale Price | Title Company |
|---|---|---|---|
| Frost Scott A | $255,000 | -- | |
| Stonegate T 2 | $195,000 | -- |
Source: Public Records
Mortgage History
| Date | Status | Borrower | Loan Amount |
|---|---|---|---|
| Open | Stonegate T 2 | $254,257 | |
| Closed | Frost Scott A | $251,060 | |
| Previous Owner | Stonegate T 2 | $210,000 |
Source: Public Records
Tax History Compared to Growth
Tax History
| Year | Tax Paid | Tax Assessment Tax Assessment Total Assessment is a certain percentage of the fair market value that is determined by local assessors to be the total taxable value of land and additions on the property. | Land | Improvement |
|---|---|---|---|---|
| 2025 | $12,325 | $705,100 | $422,300 | $282,800 |
| 2024 | $11,912 | $677,600 | $387,500 | $290,100 |
| 2023 | $11,630 | $625,600 | $362,300 | $263,300 |
| 2022 | $10,444 | $528,800 | $301,800 | $227,000 |
| 2021 | $10,325 | $505,400 | $284,600 | $220,800 |
| 2020 | $9,603 | $505,400 | $284,600 | $220,800 |
| 2019 | $9,173 | $472,600 | $251,800 | $220,800 |
| 2018 | $9,061 | $467,800 | $247,000 | $220,800 |
| 2017 | $6,639 | $338,400 | $231,000 | $107,400 |
| 2016 | $6,610 | $328,700 | $231,000 | $97,700 |
| 2015 | $6,110 | $301,000 | $211,800 | $89,200 |
| 2014 | $5,641 | $274,500 | $192,600 | $81,900 |
Source: Public Records
Map
Nearby Homes
- 12 Eastwood Rd
- 40 Bayberry Dr Unit 1
- 17 Donald Rd
- 40 Lyndon Rd
- 4 Bayberry Dr Unit 3
- 172 Wilshire Dr
- 2040 Central St
- 157 Wilshire Dr
- 74 Ethyl Way
- 11 Springwood Ave
- 115 Joanne Rd
- 39 Christopher Dr Unit B
- 30 Hampton Rd
- 15 Sparrow Rd
- 17 Patricia Dr
- 35 Patricia Dr
- 3 Trowel Shop Pond Rd Unit 3
- 20 Trowel Shop Pond Rd Unit 24
- 16 Trowel Shop Pond Rd Unit 16
- 2 Trowel Shop Pond Rd Unit 2