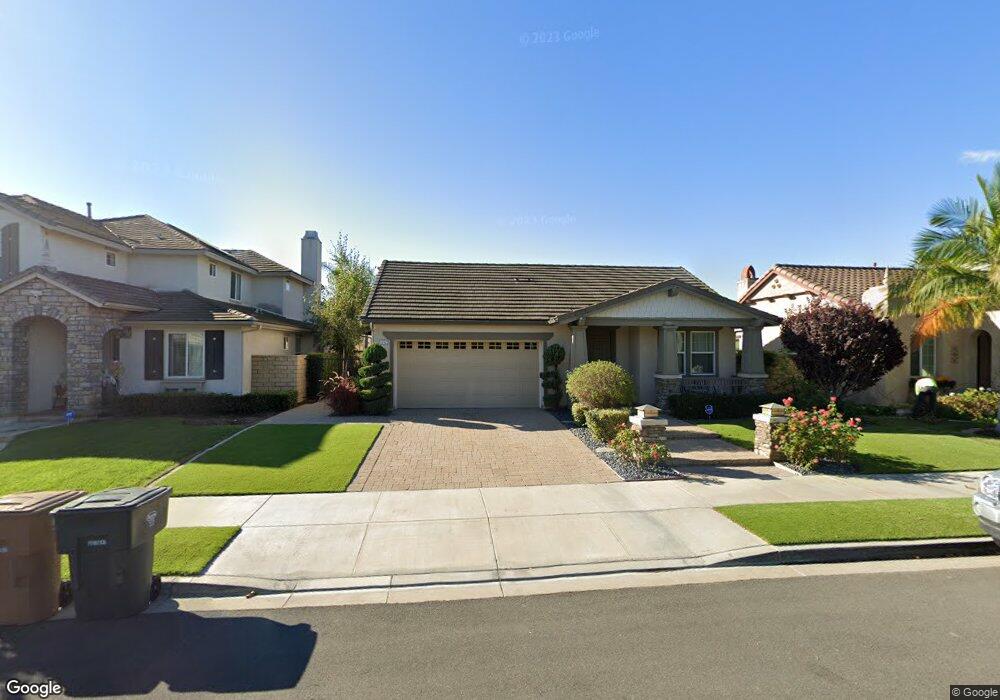
3742 East Park Camarillo, CA 93012
Estimated Value: $1,029,000 - $1,127,000
3
Beds
2
Baths
2,049
Sq Ft
$525/Sq Ft
Est. Value
About This Home
This home is located at 3742 East Park, Camarillo, CA 93012 and is currently estimated at $1,076,727, approximately $525 per square foot. 3742 East Park is a home located in Ventura County with nearby schools including Rancho Rosal Elementary School, Monte Vista Middle School, and Adolfo Camarillo High School.
Ownership History
Date
Name
Owned For
Owner Type
Purchase Details
Closed on
Nov 1, 2018
Sold by
Smith William Joseph and Smith Terry Centell
Bought by
Smith William Joseph and Smith Terry Centell
Current Estimated Value
Purchase Details
Closed on
Aug 9, 2010
Sold by
Testan Joseph and Testan Mary Ann
Bought by
Smith William Joseph and Smith Terry Centell
Home Financials for this Owner
Home Financials are based on the most recent Mortgage that was taken out on this home.
Original Mortgage
$400,000
Outstanding Balance
$264,170
Interest Rate
4.52%
Mortgage Type
New Conventional
Estimated Equity
$812,557
Purchase Details
Closed on
Feb 17, 2006
Sold by
Standard Pacific Corp
Bought by
Testan Joseph and Testan Mary Ann
Home Financials for this Owner
Home Financials are based on the most recent Mortgage that was taken out on this home.
Original Mortgage
$162,150
Interest Rate
5.69%
Mortgage Type
Stand Alone Second
Create a Home Valuation Report for This Property
The Home Valuation Report is an in-depth analysis detailing your home's value as well as a comparison with similar homes in the area
Home Values in the Area
Average Home Value in this Area
Purchase History
| Date | Buyer | Sale Price | Title Company |
|---|---|---|---|
| Smith William Joseph | -- | None Available | |
| Smith William Joseph | $500,000 | Chicago Title Company | |
| Testan Joseph | $812,000 | Lawyers Title |
Source: Public Records
Mortgage History
| Date | Status | Borrower | Loan Amount |
|---|---|---|---|
| Open | Smith William Joseph | $400,000 | |
| Previous Owner | Testan Joseph | $162,150 | |
| Previous Owner | Testan Joseph | $648,750 |
Source: Public Records
Tax History
| Year | Tax Paid | Tax Assessment Tax Assessment Total Assessment is a certain percentage of the fair market value that is determined by local assessors to be the total taxable value of land and additions on the property. | Land | Improvement |
|---|---|---|---|---|
| 2025 | $7,834 | $721,291 | $360,647 | $360,644 |
| 2024 | $7,834 | $707,149 | $353,576 | $353,573 |
| 2023 | $7,552 | $693,284 | $346,643 | $346,641 |
| 2022 | $7,528 | $679,691 | $339,846 | $339,845 |
| 2021 | $7,256 | $666,364 | $333,182 | $333,182 |
| 2020 | $7,230 | $659,532 | $329,766 | $329,766 |
| 2019 | $7,196 | $646,600 | $323,300 | $323,300 |
| 2018 | $7,062 | $633,922 | $316,961 | $316,961 |
| 2017 | $6,644 | $621,494 | $310,747 | $310,747 |
| 2016 | $6,484 | $609,308 | $304,654 | $304,654 |
| 2015 | $6,415 | $600,158 | $300,079 | $300,079 |
| 2014 | $6,264 | $588,402 | $294,201 | $294,201 |
Source: Public Records
Map
Nearby Homes
- 3812 Golden Pond Dr
- 182 Calle de la Rosa
- 167 Bellafonte Ct
- 3615 Dusk Dr
- 65 Via Sintra
- 48 Via Lisboa Unit 48
- 3748 Gazebo Ln
- 409 Spring Park Rd
- 227 Calle de la Rosa
- 4253 Pancho Rd
- 406 Town Forest Ct
- 259 Riverdale Ct Unit 241
- 259 Riverdale Ct Unit 263
- 278 Spindlewood Ave
- 4362 Milpas St
- 243 Riverdale Ct Unit 431
- 291 Riverdale Ct Unit 106
- 231 Calle Orovista
- 353 Via Cantilena Unit 87
- 395 Via Cantilena
- 3742 East Park
- 3748 East Park
- 3748 East Park
- 3716 East Park
- 3716 East Park
- 3731 Fountain St
- 3754 East Park
- 3754 East Park
- 3702 East Park
- 3711 Fountain St
- 3755 Fountain St
- 3702 East Park
- 3703 Fountain St
- 3761 Fountain St
- 3766 East Park
- 301 Bellafonte Ct
- 3709 East Park
- 3767 Fountain St
- 3709 East Park
- 3778 East Park
Your Personal Tour Guide
Ask me questions while you tour the home.