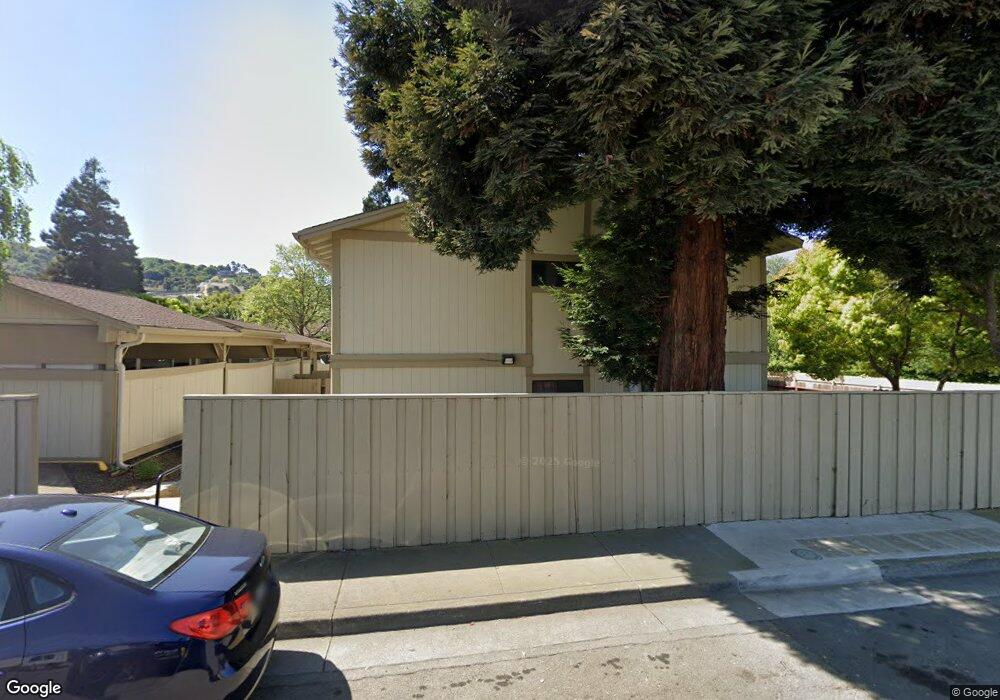
3742 Via Verdi Unit 2 El Sobrante, CA 94803
Estimated Value: $379,972 - $434,000
2
Beds
1
Bath
1,086
Sq Ft
$378/Sq Ft
Est. Value
About This Home
This home is located at 3742 Via Verdi Unit 2, El Sobrante, CA 94803 and is currently estimated at $410,493, approximately $377 per square foot. 3742 Via Verdi Unit 2 is a home located in Contra Costa County with nearby schools including Sheldon Elementary School, Betty Reid Soskin Middle School, and De Anza Senior High School.
Ownership History
Date
Name
Owned For
Owner Type
Purchase Details
Closed on
Apr 1, 2010
Sold by
Aurora Loan Services Llc
Bought by
Pang Shuofeng
Current Estimated Value
Purchase Details
Closed on
Jan 8, 2010
Sold by
Batiste Joan Davis
Bought by
Aurora Loan Services Llc
Purchase Details
Closed on
Oct 18, 2004
Sold by
Batiste Joan
Bought by
Batiste Joan Davis
Home Financials for this Owner
Home Financials are based on the most recent Mortgage that was taken out on this home.
Original Mortgage
$189,000
Interest Rate
5.82%
Mortgage Type
Stand Alone Refi Refinance Of Original Loan
Purchase Details
Closed on
Dec 4, 2002
Sold by
Bowe William E
Bought by
Batiste Joan
Home Financials for this Owner
Home Financials are based on the most recent Mortgage that was taken out on this home.
Original Mortgage
$204,950
Interest Rate
6.06%
Mortgage Type
Purchase Money Mortgage
Create a Home Valuation Report for This Property
The Home Valuation Report is an in-depth analysis detailing your home's value as well as a comparison with similar homes in the area
Home Values in the Area
Average Home Value in this Area
Purchase History
| Date | Buyer | Sale Price | Title Company |
|---|---|---|---|
| Pang Shuofeng | $95,000 | Lsi Title Company | |
| Aurora Loan Services Llc | $274,392 | Accommodation | |
| Batiste Joan Davis | -- | Fidelity National Title Co | |
| Batiste Joan | $205,000 | Commonwealth Title |
Source: Public Records
Mortgage History
| Date | Status | Borrower | Loan Amount |
|---|---|---|---|
| Previous Owner | Batiste Joan Davis | $189,000 | |
| Previous Owner | Batiste Joan | $204,950 | |
| Closed | Batiste Joan Davis | $37,800 |
Source: Public Records
Tax History Compared to Growth
Tax History
| Year | Tax Paid | Tax Assessment Tax Assessment Total Assessment is a certain percentage of the fair market value that is determined by local assessors to be the total taxable value of land and additions on the property. | Land | Improvement |
|---|---|---|---|---|
| 2025 | $2,768 | $122,611 | $25,162 | $97,449 |
| 2024 | $2,700 | $120,208 | $24,669 | $95,539 |
| 2023 | $2,700 | $117,852 | $24,186 | $93,666 |
| 2022 | $2,647 | $115,542 | $23,712 | $91,830 |
| 2021 | $2,613 | $113,278 | $23,248 | $90,030 |
| 2019 | $2,570 | $109,919 | $22,559 | $87,360 |
| 2018 | $2,456 | $107,765 | $22,117 | $85,648 |
| 2017 | $2,372 | $105,653 | $21,684 | $83,969 |
| 2016 | $2,303 | $103,582 | $21,259 | $82,323 |
| 2015 | $2,261 | $102,027 | $20,940 | $81,087 |
| 2014 | $2,247 | $100,029 | $20,530 | $79,499 |
Source: Public Records
Map
Nearby Homes
- 3760 Via Verdi
- 3764 Via Verdi Unit 13
- 4047 Mozart Dr
- 0 Montera Ct
- 3706 Montera Ct
- 4091 Garden Rd
- 4022 San Pablo Dam Rd
- 3034 Parker Rd
- 57 Parkview Terrace
- 10 Dove Ln
- 3275 Annapolis Ave
- 3944 La Cima Rd
- 3027 Colette Dr
- 6253 Bayview Ave
- 6324 Bonita Ct
- 742 Alhambra Rd
- 0 Barth Ave
- 3122 Groom Dr
- 3123 Moyers Rd
- 4370 Wesley Way
- 3742 Via Verdi
- 3740 Via Verdi Unit 1
- 3744 Via Verdi
- 3746 Via Verdi Unit 4
- 3742 Vía Verdi
- 3748 Via Verdi Unit 30
- 3750 Via Verdi Unit 6
- 3754 Via Verdi Unit 8
- 3752 Via Verdi
- 3758 Via Verdi
- 3756 Via Verdi
- 3745 Via Verdi
- 3762 Via Verdi
- 3816 Via Verdi
- 3730 Via Verdi Unkn
- 3730 Via Verdi
- 3766 Via Verdi
- 4004 Minuet Cir
- 4005 Minuet Cir
- 3770 Via Verdi