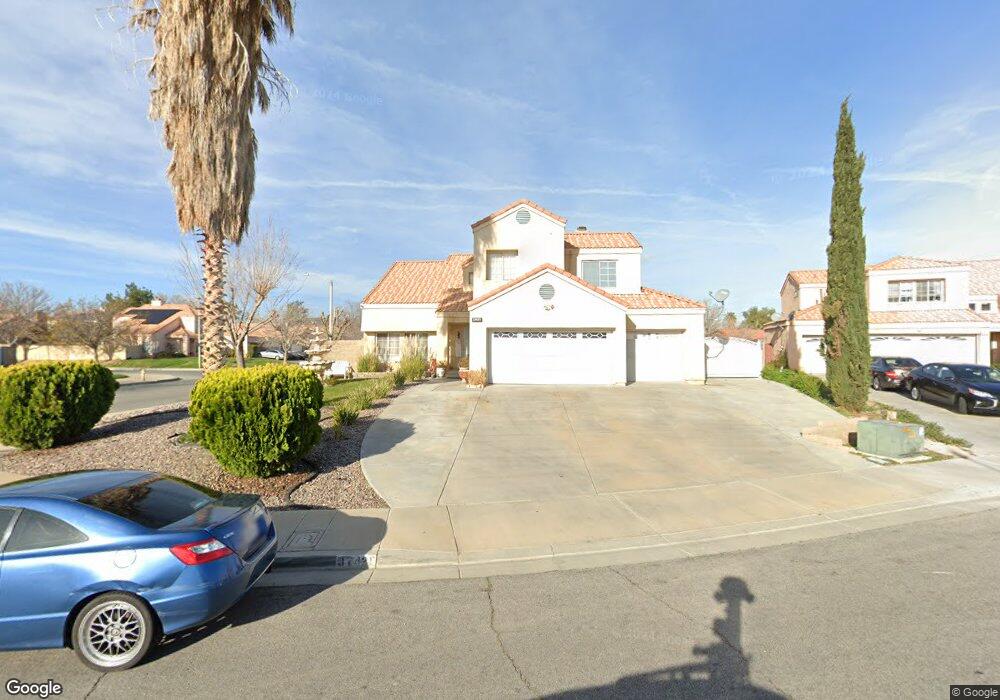
37425 Scranton Ct Palmdale, CA 93552
East Palmdale NeighborhoodEstimated Value: $511,000 - $535,000
4
Beds
3
Baths
1,947
Sq Ft
$268/Sq Ft
Est. Value
About This Home
This home is located at 37425 Scranton Ct, Palmdale, CA 93552 and is currently estimated at $522,496, approximately $268 per square foot. 37425 Scranton Ct is a home located in Los Angeles County with nearby schools including Mesquite Elementary School, Cactus Magnet Academy, and Knight High School.
Ownership History
Date
Name
Owned For
Owner Type
Purchase Details
Closed on
Nov 17, 2005
Sold by
Willis Marvin Don
Bought by
Ramirez Carlos and Medina Gloria A
Current Estimated Value
Home Financials for this Owner
Home Financials are based on the most recent Mortgage that was taken out on this home.
Original Mortgage
$284,000
Interest Rate
9.3%
Mortgage Type
Purchase Money Mortgage
Purchase Details
Closed on
Mar 13, 2000
Sold by
Willis Victoria Joyce
Bought by
Willis Marvin Don
Home Financials for this Owner
Home Financials are based on the most recent Mortgage that was taken out on this home.
Original Mortgage
$112,350
Interest Rate
8.21%
Purchase Details
Closed on
Feb 17, 2000
Sold by
Jarrahzadeh Abdol A
Bought by
Willis Marvin Don
Home Financials for this Owner
Home Financials are based on the most recent Mortgage that was taken out on this home.
Original Mortgage
$112,350
Interest Rate
8.21%
Create a Home Valuation Report for This Property
The Home Valuation Report is an in-depth analysis detailing your home's value as well as a comparison with similar homes in the area
Home Values in the Area
Average Home Value in this Area
Purchase History
| Date | Buyer | Sale Price | Title Company |
|---|---|---|---|
| Ramirez Carlos | $355,000 | Ticor Title Co | |
| Willis Marvin Don | -- | Investors Title Company | |
| Willis Marvin Don | $125,000 | Investors Title Company |
Source: Public Records
Mortgage History
| Date | Status | Borrower | Loan Amount |
|---|---|---|---|
| Previous Owner | Ramirez Carlos | $284,000 | |
| Previous Owner | Willis Marvin Don | $112,350 |
Source: Public Records
Tax History Compared to Growth
Tax History
| Year | Tax Paid | Tax Assessment Tax Assessment Total Assessment is a certain percentage of the fair market value that is determined by local assessors to be the total taxable value of land and additions on the property. | Land | Improvement |
|---|---|---|---|---|
| 2025 | $7,086 | $485,117 | $235,862 | $249,255 |
| 2024 | $7,086 | $475,606 | $231,238 | $244,368 |
| 2023 | $7,137 | $466,281 | $226,704 | $239,577 |
| 2022 | $6,815 | $457,139 | $222,259 | $234,880 |
| 2021 | $6,066 | $395,100 | $192,300 | $202,800 |
| 2019 | $5,241 | $337,000 | $164,000 | $173,000 |
| 2018 | $4,936 | $312,000 | $152,000 | $160,000 |
| 2016 | $3,827 | $233,000 | $113,800 | $119,200 |
| 2015 | $3,632 | $215,000 | $105,000 | $110,000 |
| 2014 | $3,229 | $180,000 | $87,500 | $92,500 |
Source: Public Records
Map
Nearby Homes
- 4062 Lexington Ct
- 4117 E Avenue r13
- 4023 Lexington Ct
- 4042 E Avenue r6
- 4034 E Avenue r6
- 3847 Triton Dr
- 0 45th St E
- 3811 Triton Dr
- 3646 E Avenue r10
- 4537 Elwood Ave
- 37311 47th St E Unit 187
- 37311 47th St E Unit 114
- 47th E 37311 47th St E 187 St Unit 187
- 4331 Avoca Ave
- 4633 Dowel Ave
- 3625 Toscany Ct
- 37920 Pisces Cir
- 4632 E Avenue R-6
- 37928 Pisces Cir
- 4444 E R Ave Unit 143
- 4063 E Avenue r12
- 37431 Scranton Ct
- 37437 Scranton Ct
- 4121 E Avenue r12
- 4104 E Avenue r12
- 4110 E Ave R12
- 4110 E Avenue r12
- 37438 Scranton Ct
- 4116 E Avenue r12
- 37430 Scranton Ct
- 4049 E Avenue r12
- 4056 E Avenue r12
- 4058 Karling Place
- 4052 Karling Place
- 4129 E Avenue r12
- 4046 Karling Place
- 4124 E Avenue r12
- 4108 Karling Place
- 4050 E Avenue r12
- 4105 Lexington Ct