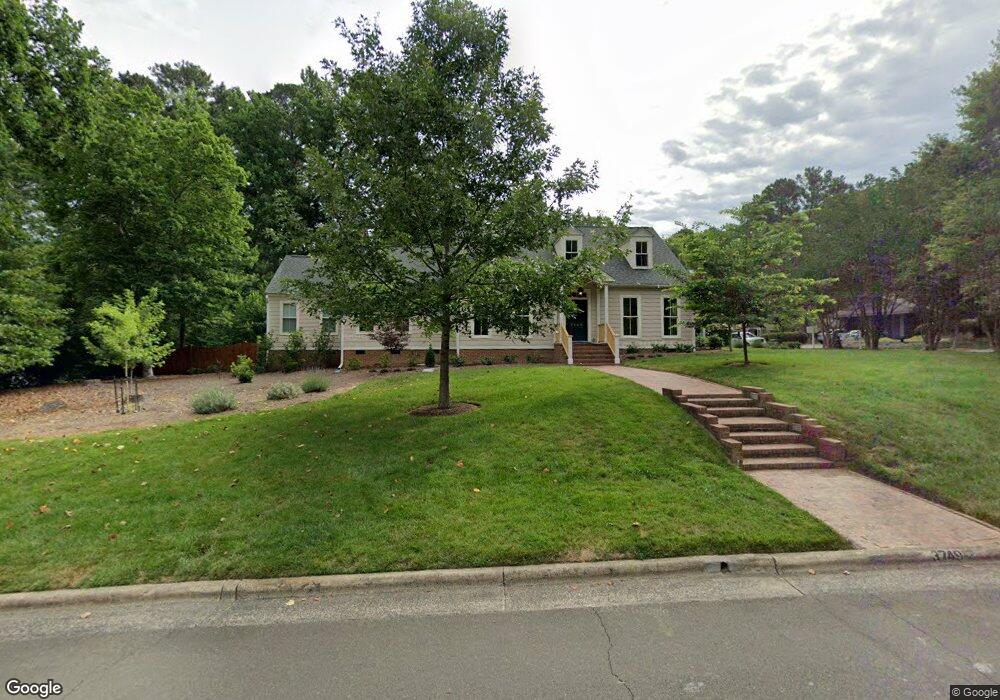
3749 St Marks Rd Durham, NC 27707
Hope Valley NeighborhoodEstimated Value: $1,160,000 - $1,292,000
4
Beds
3
Baths
3,437
Sq Ft
$351/Sq Ft
Est. Value
About This Home
This home is located at 3749 St Marks Rd, Durham, NC 27707 and is currently estimated at $1,207,796, approximately $351 per square foot. 3749 St Marks Rd is a home located in Durham County with nearby schools including Morehead Montessori, Sherwood Githens Middle, and Jordan High School.
Ownership History
Date
Name
Owned For
Owner Type
Purchase Details
Closed on
Nov 3, 2025
Sold by
Newman Joanne and Farber Stewart
Bought by
Joanne Grace Newman And Stewart Alan Farber L and Newman
Current Estimated Value
Purchase Details
Closed on
Sep 9, 2022
Sold by
Miller Kristen A and Miller Robert A
Bought by
Newman Joanne and Farber Stewart
Purchase Details
Closed on
Sep 5, 2018
Sold by
Adams Jrt Roderick D and Adams Doris Crouse
Bought by
Miller Robert A and Miller Kristen A
Home Financials for this Owner
Home Financials are based on the most recent Mortgage that was taken out on this home.
Original Mortgage
$635,000
Interest Rate
4.5%
Mortgage Type
New Conventional
Purchase Details
Closed on
Jun 12, 2002
Sold by
Nenninger Robert H and Nenninger Patricia
Bought by
Adams Doris Crouse
Purchase Details
Closed on
Sep 8, 1999
Sold by
Nenninger Robert H and Nenninger Patricia
Bought by
Nenninger Patricia
Purchase Details
Closed on
Dec 1, 1998
Sold by
Mackelcan Douglas W and Mackelcan Deborah J
Bought by
Nenninger Robert H and Nenninger Patricia
Create a Home Valuation Report for This Property
The Home Valuation Report is an in-depth analysis detailing your home's value as well as a comparison with similar homes in the area
Home Values in the Area
Average Home Value in this Area
Purchase History
| Date | Buyer | Sale Price | Title Company |
|---|---|---|---|
| Joanne Grace Newman And Stewart Alan Farber L | -- | None Listed On Document | |
| Newman Joanne | $1,225,000 | -- | |
| Miller Robert A | $635,000 | None Available | |
| Adams Doris Crouse | $379,500 | -- | |
| Nenninger Patricia | -- | -- | |
| Nenninger Robert H | $301,000 | -- |
Source: Public Records
Mortgage History
| Date | Status | Borrower | Loan Amount |
|---|---|---|---|
| Previous Owner | Miller Robert A | $635,000 |
Source: Public Records
Tax History
| Year | Tax Paid | Tax Assessment Tax Assessment Total Assessment is a certain percentage of the fair market value that is determined by local assessors to be the total taxable value of land and additions on the property. | Land | Improvement |
|---|---|---|---|---|
| 2025 | $11,540 | $1,164,132 | $385,000 | $779,132 |
| 2024 | $8,470 | $607,207 | $154,000 | $453,207 |
| 2023 | $7,954 | $607,007 | $153,800 | $453,207 |
| 2022 | $7,363 | $575,281 | $153,800 | $421,481 |
| 2021 | $7,329 | $575,281 | $153,800 | $421,481 |
| 2020 | $7,156 | $575,281 | $153,800 | $421,481 |
| 2019 | $7,156 | $575,281 | $153,800 | $421,481 |
| 2018 | $6,826 | $503,208 | $96,125 | $407,083 |
| 2017 | $6,776 | $503,208 | $96,125 | $407,083 |
| 2016 | $6,547 | $503,208 | $96,125 | $407,083 |
| 2015 | $6,733 | $486,359 | $88,234 | $398,125 |
| 2014 | -- | $486,359 | $88,234 | $398,125 |
Source: Public Records
Map
Nearby Homes
- 20 Chancery Place
- 3932 Old Chapel Hill Rd
- 3934 Old Chapel Hill Rd
- 3914 Old Chapel Hill Rd
- 38 Innisfree Dr
- 3841 Somerset Dr
- 18 Scottish Ln
- 3903 Kelly Dr
- 103 Ashworth Dr
- 3906 Sterling Ridge Ln
- 3946 Nottaway Rd
- 4014 Nottaway Rd
- 3930 Kelly Dr
- 3436 Rugby Rd
- 3514 Rugby Rd
- 4012 Nottaway Rd
- 3613 A Suffolk St
- 3613 B Suffolk St
- 4036 Nottaway Rd
- 3624 Shrewsbury St
- 3749 Saint Marks Rd
- 4005 Saint Marks Rd
- 3933 Saint Marks Rd
- 11 Chancery Place
- 3743 Saint Marks Rd
- 3801 Saint Marks Rd
- 3748 Saint Marks Rd
- 3801 St Marks Rd
- 4 Chancery Place
- 3752 St Marks Rd
- 17 Chancery Place
- 3752 Saint Marks Rd
- 3744 Saint Marks Rd
- 3744 St Marks Rd
- 4 Chancery Place
- 8 Chancery Place
- 3700 St Marks Rd
- 3700 Saint Marks Rd
- 3737 Saint Marks Rd
- 3737 St Marks Rd
Your Personal Tour Guide
Ask me questions while you tour the home.