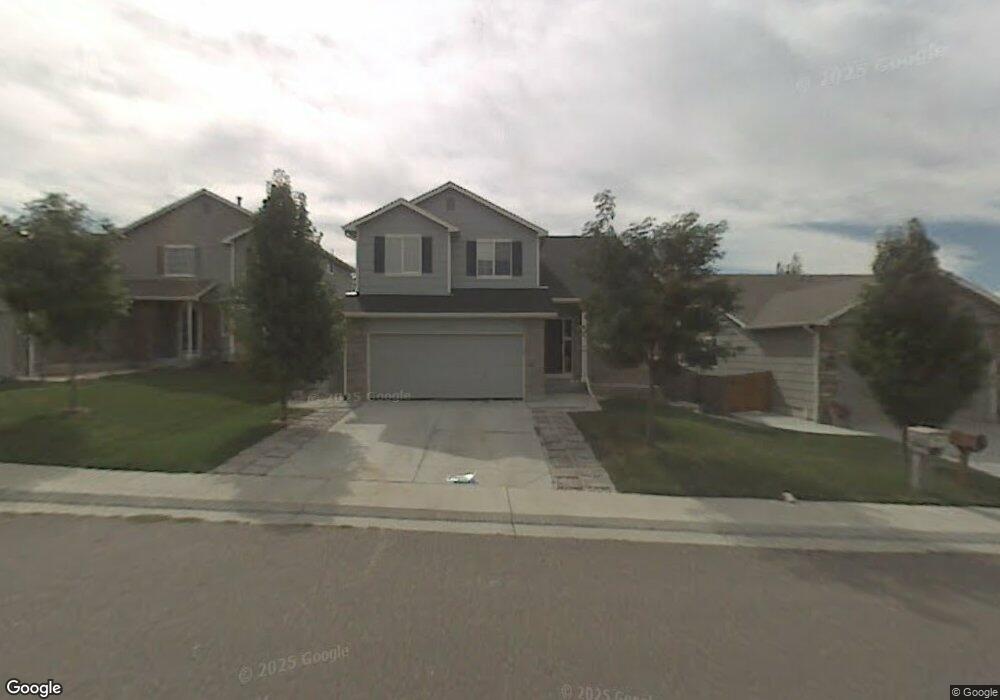
3752 E 139th Ave Thornton, CO 80602
Cherrywood Park NeighborhoodEstimated Value: $473,631 - $541,000
3
Beds
3
Baths
2,054
Sq Ft
$250/Sq Ft
Est. Value
About This Home
This home is located at 3752 E 139th Ave, Thornton, CO 80602 and is currently estimated at $512,658, approximately $249 per square foot. 3752 E 139th Ave is a home located in Adams County with nearby schools including Prairie Hills Elementary School, Rocky Top Middle School, and Horizon High School.
Ownership History
Date
Name
Owned For
Owner Type
Purchase Details
Closed on
Oct 11, 2019
Sold by
Garner Stephanie A
Bought by
Garner Jason S
Current Estimated Value
Purchase Details
Closed on
Jul 24, 2008
Sold by
Citimortgage Inc
Bought by
Garner Jason S and Garner Stephanie A
Home Financials for this Owner
Home Financials are based on the most recent Mortgage that was taken out on this home.
Original Mortgage
$182,141
Outstanding Balance
$118,058
Interest Rate
6.42%
Mortgage Type
FHA
Estimated Equity
$394,600
Purchase Details
Closed on
May 8, 2008
Sold by
Forshey Daryl W and Forshey Nicole R
Bought by
Citimortgage Inc
Purchase Details
Closed on
Dec 13, 2001
Sold by
Melody Homes Inc
Bought by
Forshey Daryl W and Forshey Nicole R
Home Financials for this Owner
Home Financials are based on the most recent Mortgage that was taken out on this home.
Original Mortgage
$178,350
Interest Rate
6.52%
Create a Home Valuation Report for This Property
The Home Valuation Report is an in-depth analysis detailing your home's value as well as a comparison with similar homes in the area
Home Values in the Area
Average Home Value in this Area
Purchase History
| Date | Buyer | Sale Price | Title Company |
|---|---|---|---|
| Garner Jason S | -- | None Available | |
| Garner Jason S | $185,000 | Chicago Title Co | |
| Citimortgage Inc | -- | None Available | |
| Forshey Daryl W | $206,126 | Land Title |
Source: Public Records
Mortgage History
| Date | Status | Borrower | Loan Amount |
|---|---|---|---|
| Open | Garner Jason S | $182,141 | |
| Previous Owner | Forshey Daryl W | $178,350 |
Source: Public Records
Tax History
| Year | Tax Paid | Tax Assessment Tax Assessment Total Assessment is a certain percentage of the fair market value that is determined by local assessors to be the total taxable value of land and additions on the property. | Land | Improvement |
|---|---|---|---|---|
| 2025 | $3,417 | $34,480 | $7,140 | $27,340 |
| 2024 | $3,417 | $31,690 | $6,560 | $25,130 |
| 2023 | $3,382 | $36,740 | $6,770 | $29,970 |
| 2022 | $2,774 | $25,180 | $6,600 | $18,580 |
| 2021 | $2,866 | $25,180 | $6,600 | $18,580 |
| 2020 | $2,807 | $25,160 | $6,790 | $18,370 |
| 2019 | $2,813 | $25,160 | $6,790 | $18,370 |
| 2018 | $2,708 | $23,530 | $7,490 | $16,040 |
| 2017 | $2,462 | $23,530 | $7,490 | $16,040 |
| 2016 | $1,998 | $18,590 | $3,820 | $14,770 |
| 2015 | $1,995 | $18,590 | $3,820 | $14,770 |
| 2014 | -- | $16,900 | $3,580 | $13,320 |
Source: Public Records
Map
Nearby Homes
- 13638 Garfield St Unit C
- 13604 Garfield St Unit E
- 13963 Cook St
- 13845 Adams Cir
- 3592 E 141st Place
- 3593 E 141st Place
- 0 Colorado Blvd
- 3583 E 141st Place
- 13876 Milwaukee St
- 13521 Albion St
- 13488 Monroe St
- 13850 Dexter St
- 4590 E 136th Place
- 14057 Fillmore Dr
- 13686 Dexter St
- 2615 Signal Creek Dr
- 13441 Cherry St
- 3067 E 143rd Ave
- 15276 Pontiac St
- 15286 Pontiac St
- 3762 E 139th Ave
- 3742 E 139th Ave
- 3741 E 138th Place
- 3732 E 139th Ave
- 3772 E 139th Ave
- 3751 E 138th Place
- 3731 E 138th Place
- 13905 Jackson St
- 3761 E 138th Place
- 3721 E 138th Place
- 3722 E 139th Ave
- 13904 Garfield Dr
- 3711 E 138th Place
- 13909 Jackson St
- 3712 E 139th Ave
- 3802 E 139th Ave
- 13910 Jackson St
- 3801 E 138th Place
- 13853 Jackson St
- 13908 Garfield Dr
Your Personal Tour Guide
Ask me questions while you tour the home.