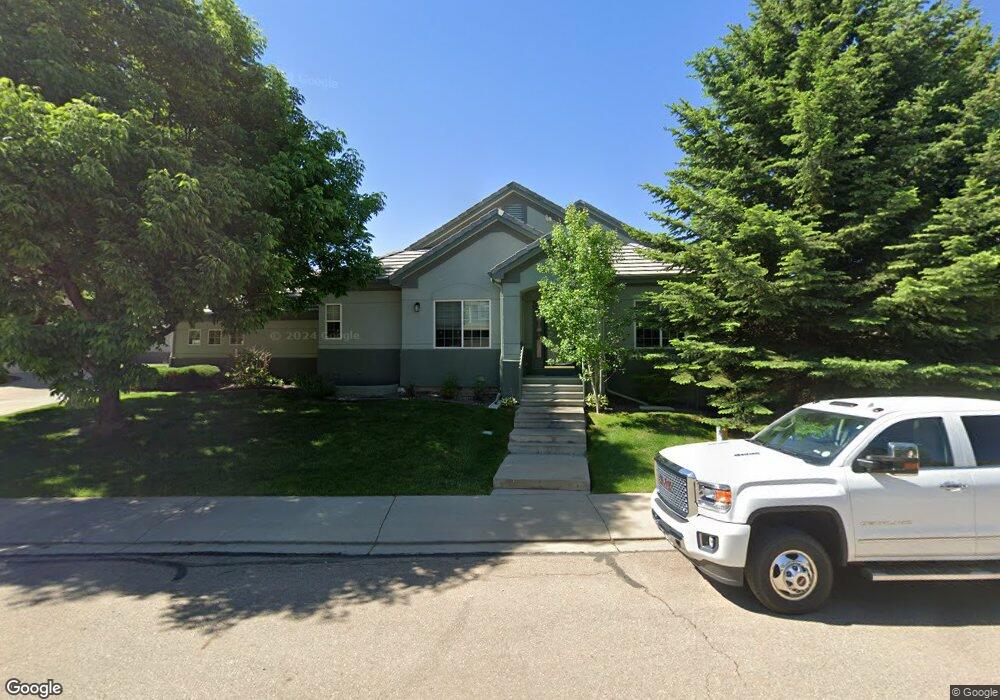
3752 Florentine Cir Unit 3752 Longmont, CO 80503
Upper Clover Basin NeighborhoodEstimated Value: $501,000 - $565,000
2
Beds
3
Baths
2,334
Sq Ft
$226/Sq Ft
Est. Value
About This Home
This home is located at 3752 Florentine Cir Unit 3752, Longmont, CO 80503 and is currently estimated at $527,407, approximately $225 per square foot. 3752 Florentine Cir Unit 3752 is a home located in Boulder County with nearby schools including Eagle Crest Elementary School, Altona Middle School, and Silver Creek High School.
Ownership History
Date
Name
Owned For
Owner Type
Purchase Details
Closed on
May 21, 2014
Sold by
Turner Terri and Estate Of Charlie L Moore
Bought by
Hutchings Chris William
Current Estimated Value
Home Financials for this Owner
Home Financials are based on the most recent Mortgage that was taken out on this home.
Original Mortgage
$244,000
Outstanding Balance
$186,304
Interest Rate
4.38%
Mortgage Type
New Conventional
Estimated Equity
$341,103
Purchase Details
Closed on
Jan 30, 2004
Sold by
Lacy Anita E
Bought by
Moore Charlie L
Purchase Details
Closed on
Jan 4, 2001
Sold by
Heritage Greens At Legacy Ridge Llp
Bought by
Lacy Anita E
Home Financials for this Owner
Home Financials are based on the most recent Mortgage that was taken out on this home.
Original Mortgage
$133,000
Interest Rate
7.78%
Create a Home Valuation Report for This Property
The Home Valuation Report is an in-depth analysis detailing your home's value as well as a comparison with similar homes in the area
Home Values in the Area
Average Home Value in this Area
Purchase History
| Date | Buyer | Sale Price | Title Company |
|---|---|---|---|
| Hutchings Chris William | $305,000 | Fntc | |
| Moore Charlie L | $277,500 | Fahtco | |
| Lacy Anita E | $247,143 | -- |
Source: Public Records
Mortgage History
| Date | Status | Borrower | Loan Amount |
|---|---|---|---|
| Open | Hutchings Chris William | $244,000 | |
| Previous Owner | Lacy Anita E | $133,000 | |
| Closed | Lacy Anita E | $65,000 |
Source: Public Records
Tax History Compared to Growth
Tax History
| Year | Tax Paid | Tax Assessment Tax Assessment Total Assessment is a certain percentage of the fair market value that is determined by local assessors to be the total taxable value of land and additions on the property. | Land | Improvement |
|---|---|---|---|---|
| 2025 | $3,313 | $35,832 | $4,813 | $31,019 |
| 2024 | $3,313 | $35,832 | $4,813 | $31,019 |
| 2023 | $3,268 | $34,639 | $5,112 | $33,212 |
| 2022 | $3,067 | $30,990 | $3,871 | $27,119 |
| 2021 | $3,106 | $31,882 | $3,983 | $27,899 |
| 2020 | $3,006 | $30,945 | $3,718 | $27,227 |
| 2019 | $2,959 | $30,945 | $3,718 | $27,227 |
| 2018 | $2,548 | $26,820 | $3,312 | $23,508 |
| 2017 | $2,513 | $29,651 | $3,662 | $25,989 |
| 2016 | $2,241 | $23,442 | $4,696 | $18,746 |
| 2015 | $2,135 | $21,262 | $4,856 | $16,406 |
| 2014 | $1,986 | $21,262 | $4,856 | $16,406 |
Source: Public Records
Map
Nearby Homes
- 3742 Florentine Cir Unit 3742
- 1148 Chestnut Dr
- 1104 Chestnut Dr
- 3600 Quail Rd
- 1108 Chokecherry Ln
- 1004 Chokecherry Ln
- 4101 Da Vinci Dr Unit 4101
- 4033 Hawthorne Cir
- 1580 Venice Ln
- 3617 Sunflower Cir
- 3608 Boxelder Dr
- 906 Cranberry Ct
- 1601 Venice Ln
- 791 Thornwood Cir
- 1667 Venice Ln
- 767 Thornwood Cir
- 690 Stonebridge Dr
- 1451 Wildrose Dr
- 1432 Wildrose Dr
- 640 Gooseberry Dr Unit 208
- 3754 Florentine Cir Unit 3754
- 3756 Florentine Cir Unit 3756
- 3748 Florentine Cir Unit 3748
- 3766 Florentine Cir Unit 3766
- 3746 Florentine Cir
- 3768 Florentine Cir Unit 3768
- 3760 Florentine Cir Unit 3760
- 3732 Florentine Cir Unit 3732
- 3734 Florentine Cir Unit 3734
- 3730 Florentine Cir Unit 3730
- 3762 Florentine Cir Unit 3762
- 3738 Florentine Cir Unit 3738
- 3744 Florentine Cir Unit 3744
- 3740 Florentine Cir Unit 3740
- 3770 Florentine Cir Unit 3770
- 3764 Florentine Cir Unit 3764
- 3745 Florentine Cir
- 3806 Florentine Cir Unit 3806
- 3751 Florentine Cir
- 3800 Florentine Cir Unit 3800