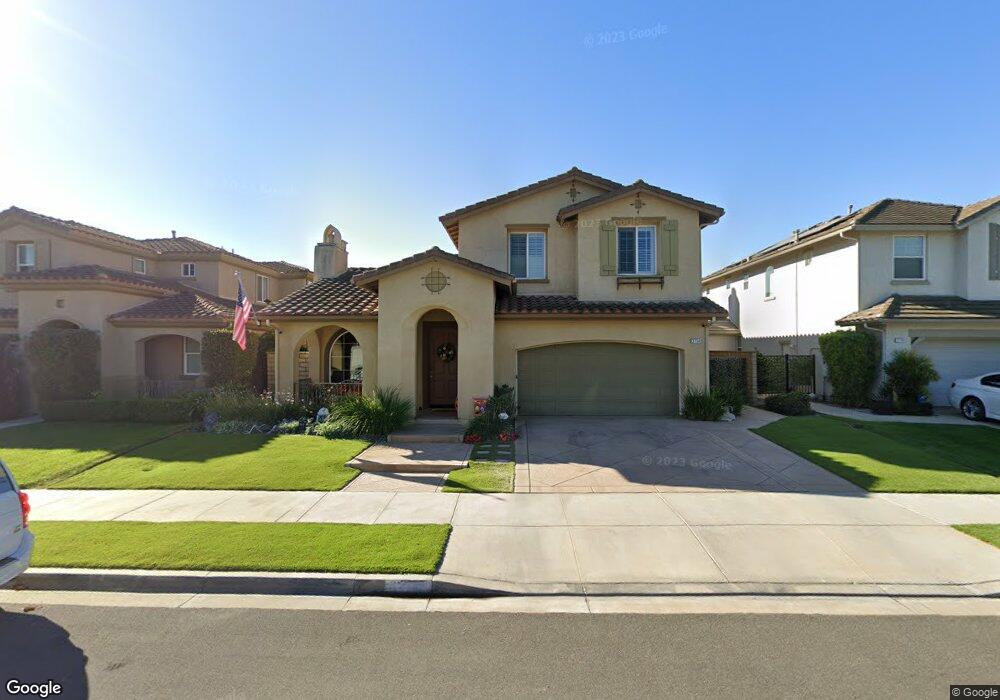
3754 East Park Camarillo, CA 93012
Estimated Value: $1,257,706 - $1,395,000
4
Beds
3
Baths
3,180
Sq Ft
$418/Sq Ft
Est. Value
About This Home
This home is located at 3754 East Park, Camarillo, CA 93012 and is currently estimated at $1,329,427, approximately $418 per square foot. 3754 East Park is a home located in Ventura County with nearby schools including Rancho Rosal Elementary School, Monte Vista Middle School, and Adolfo Camarillo High School.
Ownership History
Date
Name
Owned For
Owner Type
Purchase Details
Closed on
Jan 22, 2018
Current Estimated Value
Purchase Details
Closed on
Jan 27, 2011
Sold by
Us Bank National Association
Home Financials for this Owner
Home Financials are based on the most recent Mortgage that was taken out on this home.
Original Mortgage
$325,000
Outstanding Balance
$223,022
Interest Rate
4.84%
Mortgage Type
New Conventional
Estimated Equity
$1,106,405
Purchase Details
Closed on
Oct 4, 2010
Sold by
Thomassen Mark and Thomassen Jacquita
Bought by
Us Bank National Association
Purchase Details
Closed on
Feb 10, 2006
Sold by
Standard Pacific Corp
Bought by
Thomassen Mark and Thomassen Jaquita
Home Financials for this Owner
Home Financials are based on the most recent Mortgage that was taken out on this home.
Original Mortgage
$752,760
Interest Rate
6.12%
Mortgage Type
Purchase Money Mortgage
Create a Home Valuation Report for This Property
The Home Valuation Report is an in-depth analysis detailing your home's value as well as a comparison with similar homes in the area
Home Values in the Area
Average Home Value in this Area
Purchase History
| Date | Buyer | Sale Price | Title Company |
|---|---|---|---|
| -- | -- | None Available | |
| -- | $580,000 | First American Title Company | |
| Us Bank National Association | $629,000 | Accommodation | |
| Thomassen Mark | $942,000 | None Available |
Source: Public Records
Mortgage History
| Date | Status | Borrower | Loan Amount |
|---|---|---|---|
| Open | -- | $325,000 | |
| Previous Owner | Thomassen Mark | $752,760 |
Source: Public Records
Tax History Compared to Growth
Tax History
| Year | Tax Paid | Tax Assessment Tax Assessment Total Assessment is a certain percentage of the fair market value that is determined by local assessors to be the total taxable value of land and additions on the property. | Land | Improvement |
|---|---|---|---|---|
| 2025 | $8,126 | $748,356 | $371,535 | $376,821 |
| 2024 | $8,126 | $733,683 | $364,250 | $369,433 |
| 2023 | $7,833 | $719,298 | $357,108 | $362,190 |
| 2022 | $7,808 | $705,195 | $350,106 | $355,089 |
| 2021 | $7,526 | $691,368 | $343,241 | $348,127 |
| 2020 | $7,499 | $684,280 | $339,722 | $344,558 |
| 2019 | $7,464 | $670,863 | $333,061 | $337,802 |
| 2018 | $7,325 | $657,710 | $326,531 | $331,179 |
| 2017 | $6,892 | $644,815 | $320,129 | $324,686 |
| 2016 | $6,799 | $632,172 | $313,852 | $318,320 |
| 2015 | $6,728 | $622,679 | $309,139 | $313,540 |
| 2014 | $6,526 | $606,170 | $303,085 | $303,085 |
Source: Public Records
Map
Nearby Homes
- 142 Via Rosal
- 3548 Bridgehampton Way
- 95 Camino Algarve Unit 95
- 113 Camino Valverde Unit 113
- 3367 Shadetree Way
- 89 Via Gabilan
- 167 Bellafonte Ct
- 3343 Shadetree Way
- 409 Spring Park Rd
- 343 Village Commons Blvd
- 48 Via Lisboa Unit 48
- 31 Via Paloma
- 143 Flora Vista Ave
- 209 Riverdale Ct Unit 560
- 4387 Leatherwood Ct
- 167 Westpark Ct Unit 102
- 269 Via Cantilena
- 353 Via Cantilena Unit 87
- 302 Marlee Ln
- 62 + Calleguas
- 3754 East Park
- 3766 East Park
- 3748 East Park
- 3748 East Park
- 3761 Fountain St
- 3778 East Park
- 3778 East Park
- 3742 East Park
- 3755 Fountain St
- 3767 Fountain St
- 3742 East Park
- 3731 Fountain St
- 3779 Fountain St
- 3716 East Park
- 3790 East Park
- 3716 East Park
- 3709 East Park
- 3777 East Park
- 3709 East Park
- 3777 East Park