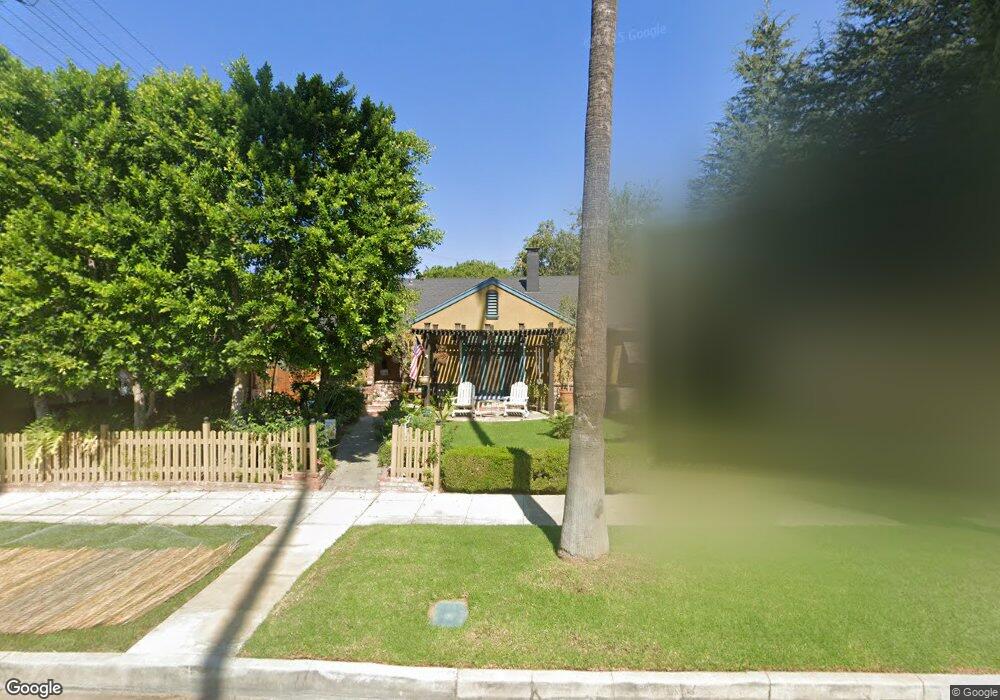
3757 Larchwood Place Riverside, CA 92506
Wood Streets NeighborhoodEstimated Value: $685,000 - $735,000
4
Beds
2
Baths
1,662
Sq Ft
$423/Sq Ft
Est. Value
About This Home
This home is located at 3757 Larchwood Place, Riverside, CA 92506 and is currently estimated at $703,731, approximately $423 per square foot. 3757 Larchwood Place is a home located in Riverside County with nearby schools including Pachappa Elementary School, Central Middle School, and Polytechnic High School.
Ownership History
Date
Name
Owned For
Owner Type
Purchase Details
Closed on
Sep 7, 2022
Sold by
Desimone Deborah A
Bought by
Desimone Family Trust
Current Estimated Value
Purchase Details
Closed on
Oct 26, 2015
Sold by
Desimone Deborah A
Bought by
Dayton Stephen Kirk and Desimone Deborah A
Purchase Details
Closed on
Jun 1, 2001
Sold by
Mcinteer Robert E and Mcinteer Corinne R
Bought by
Desimone Daniel J and Desimone Deborah A
Home Financials for this Owner
Home Financials are based on the most recent Mortgage that was taken out on this home.
Original Mortgage
$150,300
Interest Rate
7.24%
Mortgage Type
Purchase Money Mortgage
Purchase Details
Closed on
Apr 25, 1997
Sold by
Green Richard C and Green Kristy L
Bought by
Mcinteer Robert E and Mcinteer Corinne R
Create a Home Valuation Report for This Property
The Home Valuation Report is an in-depth analysis detailing your home's value as well as a comparison with similar homes in the area
Home Values in the Area
Average Home Value in this Area
Purchase History
| Date | Buyer | Sale Price | Title Company |
|---|---|---|---|
| Desimone Family Trust | -- | -- | |
| Dayton Stephen Kirk | -- | Accommodation | |
| Desimone Daniel J | $188,000 | United Title Company | |
| Mcinteer Robert E | -- | First American Title Ins Co |
Source: Public Records
Mortgage History
| Date | Status | Borrower | Loan Amount |
|---|---|---|---|
| Previous Owner | Desimone Daniel J | $150,300 |
Source: Public Records
Tax History Compared to Growth
Tax History
| Year | Tax Paid | Tax Assessment Tax Assessment Total Assessment is a certain percentage of the fair market value that is determined by local assessors to be the total taxable value of land and additions on the property. | Land | Improvement |
|---|---|---|---|---|
| 2025 | $3,076 | $287,694 | $51,688 | $236,006 |
| 2023 | $3,076 | $276,525 | $49,682 | $226,843 |
| 2022 | $3,004 | $271,104 | $48,708 | $222,396 |
| 2021 | $2,971 | $265,789 | $47,753 | $218,036 |
| 2020 | $2,948 | $263,065 | $47,264 | $215,801 |
| 2019 | $2,891 | $257,908 | $46,338 | $211,570 |
| 2018 | $2,834 | $252,852 | $45,431 | $207,421 |
| 2017 | $2,783 | $247,895 | $44,541 | $203,354 |
| 2016 | $2,605 | $243,035 | $43,668 | $199,367 |
| 2015 | $2,566 | $239,386 | $43,013 | $196,373 |
| 2014 | $2,541 | $234,698 | $42,171 | $192,527 |
Source: Public Records
Map
Nearby Homes
- 5062 Magnolia Ave
- 3594 Castle Reagh Place
- 4056 Ramona Dr
- 3569 Bandini Ave
- 4581 Main St
- 4562 Orange St
- 3515 Linwood Place
- 4033 Linwood Place
- 5571 Magnolia Ave
- 3831 Oakwood Place
- 3992 Linwood Place
- 4070 Linwood Place
- 4474 Highland Place
- 3648 Rosewood Place
- 3096 Panorama Rd Unit D
- 5151 Garwood Ct
- 5199 Garwood Ct
- 3637 Jurupa Ave
- 3719 Jurupa Ave
- 2992 Date St
- 3745 Larchwood Place
- 3733 Larchwood Place
- 4970 Magnolia Ave
- 4990 Magnolia Ave
- 4948 Magnolia Ave
- 3756 Ramona Dr
- 3744 Ramona Dr
- 3721 Larchwood Place
- 4930 Magnolia Ave
- 3794 Ramona Dr
- 3732 Ramona Dr
- 3756 Larchwood Place
- 5012 Magnolia Ave
- 3796 Ramona Dr
- 3744 Larchwood Place
- 3709 Larchwood Place
- 3732 Larchwood Place
- 3720 Ramona Dr
- 4910 Magnolia Ave
- 3487 Ramona Dr