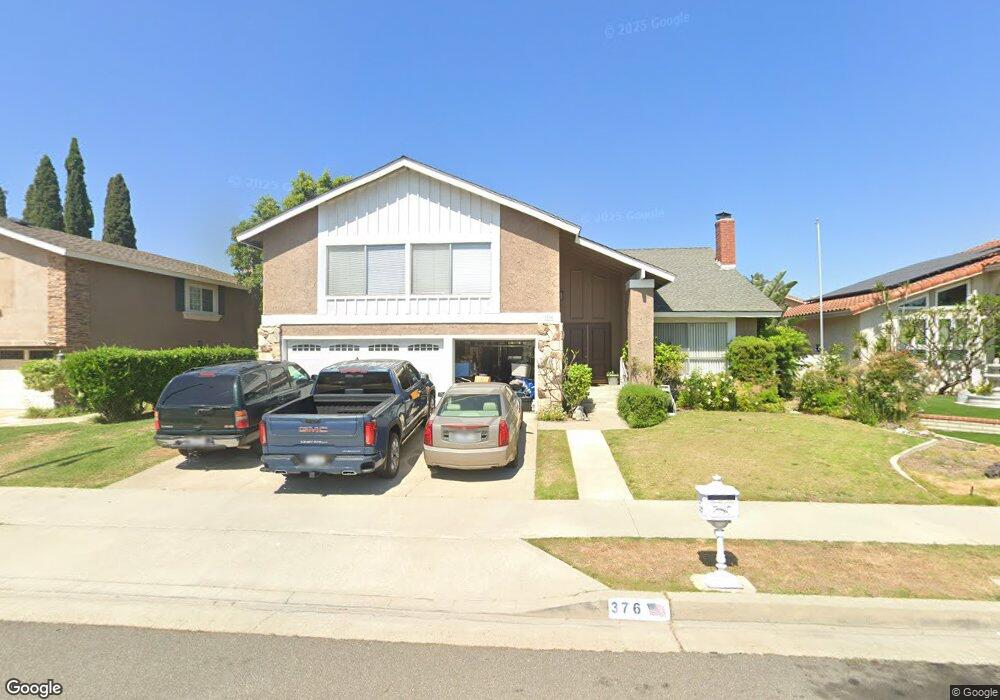
376 S Tracy Ln Orange, CA 92869
Estimated Value: $1,338,000 - $1,488,375
About This Home
This home is located at 376 S Tracy Ln, Orange, CA 92869 and is currently estimated at $1,413,594, approximately $503 per square foot. 376 S Tracy Ln is a home located in Orange County with nearby schools including La Veta Elementary School, El Modena High School, and St. John's Lutheran School.
Ownership History
We collect this data history from publicly available records. To have your information removed, we recommend requesting removal directly through your county’s website.
Purchase Details
Home Financials for this Owner
Home Financials are based on the most recent Mortgage that was taken out on this home.Purchase Details
Purchase Details
Home Financials for this Owner
Home Financials are based on the most recent Mortgage that was taken out on this home.Purchase Details
Home Values in the Area
Average Home Value in this Area
Purchase History
We collect this data history from publicly available records. To have your information removed, we recommend requesting removal directly through your county’s website.
| Date | Buyer | Sale Price | Title Company |
|---|---|---|---|
| -- | Orange Coast Title Lender Se | ||
| -- | Accommodation | ||
| -- | None Available | ||
| -- | First American Title Co | ||
| -- | -- |
Mortgage History
We collect this data history from publicly available records. To have your information removed, we recommend requesting removal directly through your county’s website.
| Date | Status | Borrower | Loan Amount |
|---|---|---|---|
| Closed | $230,000 | ||
| Closed | $176,200 |
Tax History
We collect this data history from publicly available records. To have your information removed, we recommend requesting removal directly through your county’s website.
| Year | Tax Paid | Tax Assessment Tax Assessment Total Assessment is a certain percentage of the fair market value that is determined by local assessors to be the total taxable value of land and additions on the property. | Land | Improvement |
|---|---|---|---|---|
| 2025 | $2,217 | $183,245 | $55,165 | $128,080 |
| 2024 | $2,217 | $179,652 | $54,083 | $125,569 |
| 2023 | $2,164 | $176,130 | $53,023 | $123,107 |
| 2022 | $2,118 | $172,677 | $51,983 | $120,694 |
| 2021 | $2,061 | $169,292 | $50,964 | $118,328 |
| 2020 | $2,041 | $167,557 | $50,442 | $117,115 |
| 2019 | $2,017 | $164,272 | $49,453 | $114,819 |
| 2018 | $1,986 | $161,051 | $48,483 | $112,568 |
| 2017 | $1,909 | $157,894 | $47,533 | $110,361 |
| 2016 | $1,873 | $154,799 | $46,601 | $108,198 |
| 2015 | $1,844 | $152,474 | $45,901 | $106,573 |
| 2014 | $1,804 | $149,488 | $45,002 | $104,486 |
Map
- 1925 E La Veta Ave Unit 65
- 547 S Yorba St
- 2729 E Dorothy Place
- 2748 E Dorothy Place
- 629 S Yorba St
- 1612 E Palmyra Ave
- 1519 E Van Bibber Ave
- 328 S Violet Ln
- 155 S Lincoln St
- 466 S Wellington Rd
- 1339 E Greenview Dr
- 1314 E Chapman Ave
- 1213 E Sunflower Cir Unit 110
- 3139 E Chapman Ave Unit 3B
- 3139 E Chapman Ave Unit 5A
- 390 N Milford Rd
- 537 S Gardner Dr
- 333 335,337 E La Veta
- 17821 Fairhaven Ave
- 178 N Monterey Rd
- 390 S Tracy Ln
- 368 S Tracy Ln
- 379 S Jennifer Ln
- 391 S Jennifer Ln
- 402 S Tracy Ln
- 354 S Tracy Ln
- 385 S Tracy Ln
- 373 S Tracy Ln
- 403 S Jennifer Ln
- 355 S Jennifer Ln
- 397 S Tracy Ln
- 367 S Tracy Ln
- 414 S Tracy Ln
- 346 S Tracy Ln
- 407 S Tracy Ln
- 415 S Jennifer Ln
- 347 S Jennifer Ln
- 349 S Tracy Ln
- 384 S Teri Ln
- 372 S Teri Ln
Ask me questions while you tour the home.