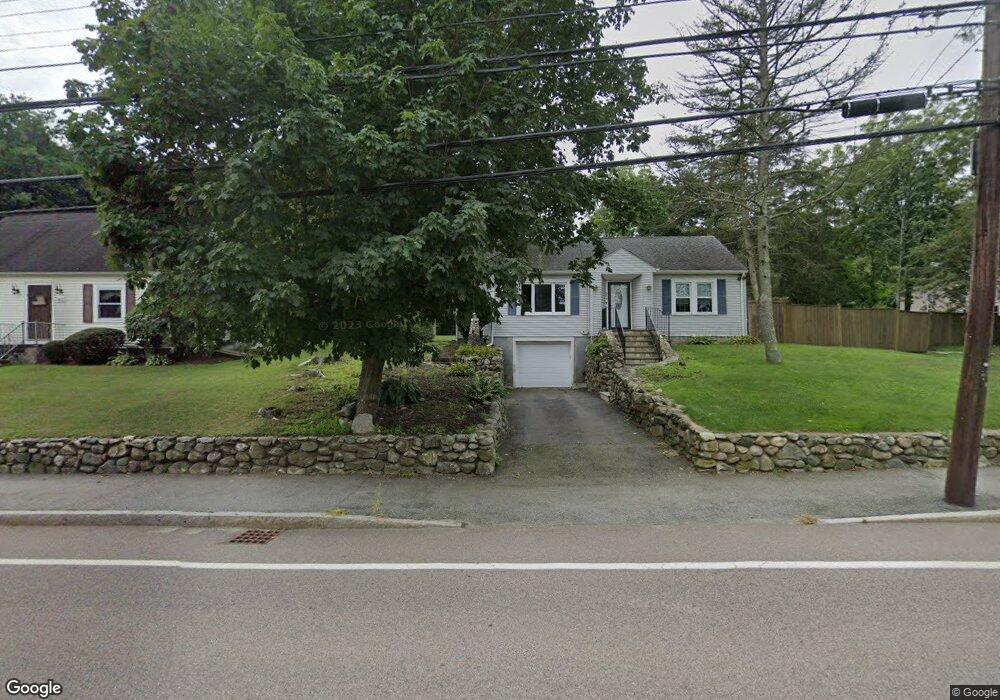
376 Water St Framingham, MA 01701
Nobscot NeighborhoodEstimated Value: $953,000 - $1,040,000
3
Beds
2
Baths
2,787
Sq Ft
$356/Sq Ft
Est. Value
About This Home
This home is located at 376 Water St, Framingham, MA 01701 and is currently estimated at $991,881, approximately $355 per square foot. 376 Water St is a home located in Middlesex County with nearby schools including Framingham High School, MetroWest Jewish Day School, and Sudbury Valley School.
Ownership History
Date
Name
Owned For
Owner Type
Purchase Details
Closed on
Jun 2, 1997
Sold by
Sweeney James F and Sweeney Susanne P
Bought by
Camuso John W and Camuso Cynthia M
Current Estimated Value
Purchase Details
Closed on
Jul 25, 1991
Sold by
Johnson V Robert
Bought by
Camuso John W and Camuso Cynthia M
Create a Home Valuation Report for This Property
The Home Valuation Report is an in-depth analysis detailing your home's value as well as a comparison with similar homes in the area
Home Values in the Area
Average Home Value in this Area
Purchase History
| Date | Buyer | Sale Price | Title Company |
|---|---|---|---|
| Camuso John W | $2,000 | -- | |
| Camuso John W | $2,000 | -- | |
| Camuso John W | $79,500 | -- | |
| Camuso John W | $79,500 | -- |
Source: Public Records
Mortgage History
| Date | Status | Borrower | Loan Amount |
|---|---|---|---|
| Open | Camuso John W | $65,000 |
Source: Public Records
Tax History Compared to Growth
Tax History
| Year | Tax Paid | Tax Assessment Tax Assessment Total Assessment is a certain percentage of the fair market value that is determined by local assessors to be the total taxable value of land and additions on the property. | Land | Improvement |
|---|---|---|---|---|
| 2025 | $12,102 | $1,013,600 | $277,700 | $735,900 |
| 2024 | $11,805 | $947,400 | $247,900 | $699,500 |
| 2023 | $11,162 | $852,700 | $221,300 | $631,400 |
| 2022 | $10,767 | $783,600 | $200,800 | $582,800 |
| 2021 | $10,362 | $737,500 | $193,000 | $544,500 |
| 2020 | $10,676 | $712,700 | $175,400 | $537,300 |
| 2019 | $10,449 | $679,400 | $175,400 | $504,000 |
| 2018 | $10,647 | $652,400 | $168,800 | $483,600 |
| 2017 | $10,686 | $639,500 | $163,900 | $475,600 |
| 2016 | $10,216 | $587,800 | $163,900 | $423,900 |
| 2015 | $9,477 | $531,800 | $163,800 | $368,000 |
Source: Public Records
Map
Nearby Homes
- 227 Water St
- 2 Chesterfield St
- 11 Edith Rd
- 19 Park Ave
- 13 Edith Rd
- 1 Harvard Rd
- 36 Cider Mill Rd
- 81 Nicholas Rd Unit B
- 71 Nicholas Rd Unit H
- 40 Gregory Rd
- 62 Central St
- 472 Potter Rd
- 38 Bradford Rd
- 102 Spruce St
- 108 Cherry St
- 2010 Windsor Dr
- 54 Roundtop Rd
- 1376 Concord St
- 11 Danforth Park Rd
- 7 Ballydrain Rd