NOT LISTED FOR SALE

37681 Sandy Trap Dr Unit 1003 Ocean View, DE 19970

Estimated Value: $579,273 - $750,000

4 Beds
3.5 Baths
-- Sq Ft
5,532 Sq Ft Lot

Last Sold November 16, 2012

Last sale price $449,688

Est. 48% increase in value since last sale

Current estimated payment $3,630/month

Highlights

  • 1 Dock Slip
  • Waterfront
  • Furnished
  • Lord Baltimore Elementary School Rated A-
  • Canal View
  • Community Pool

About This Home

As of November 2012

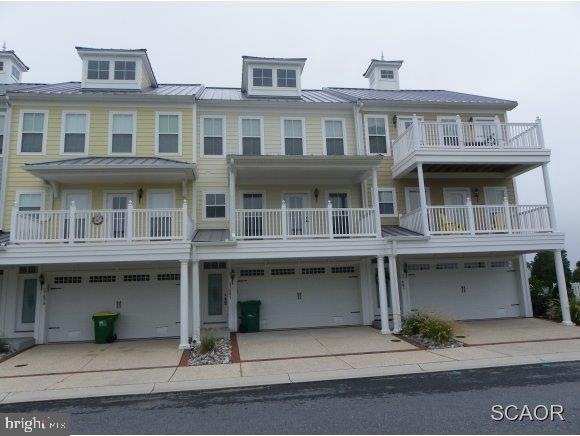
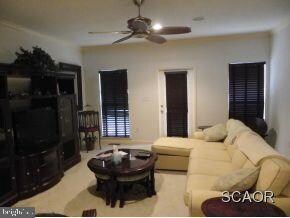
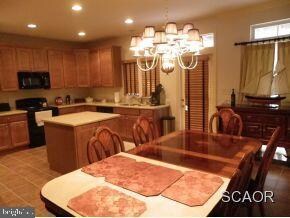
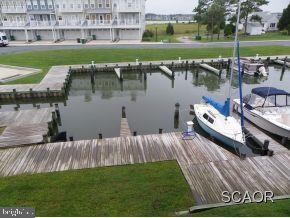
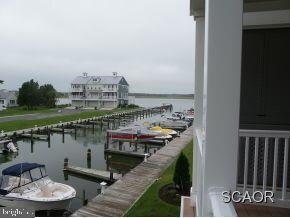
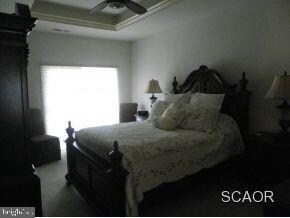
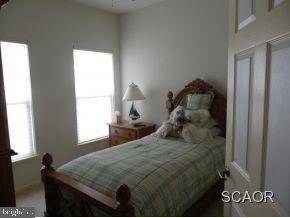
Spacious waterfront townhouse with deeded boat slip. Upgraded kitchen and trim package. Community pool and great access to Indian River Bay.

Last Agent to Sell the Property

Nancy Rhodes

(302) 537-3400 tim@timrhodes.com RE/MAX Coastal Listed on: 05/24/2011

RE/MAX Coastal

Last Buyer's Agent

Joe Reed

(302) 430-4060 joe@reedventures.net Cape Realty

Townhouse Details

Home Type

  • Townhome

Est. Annual Taxes

  • $1,146

Year Built

  • Built in 2008

Lot Details

  • Waterfront
  • Cleared Lot

Parking

  • Attached Garage

Home Design

  • Entry on the 1st floor
  • Block Foundation
  • Architectural Shingle Roof
  • Vinyl Siding
  • Stick Built Home

Interior Spaces

  • Property has 3 Levels
  • Furnished
  • Ceiling Fan
  • Gas Fireplace
  • Window Screens
  • Breakfast Room
  • Canal Views

Kitchen

  • Eat-In Kitchen
  • Self-Cleaning Oven
  • Microwave
  • Ice Maker
  • Dishwasher
  • Disposal

Flooring

  • Carpet
  • Tile or Brick

Bedrooms and Bathrooms

  • 4 Bedrooms

Laundry

  • Electric Dryer
  • Washer

Outdoor Features

  • Water Access
  • Property is near a canal
  • 1 Dock Slip
  • Balcony

Additional Features

  • Flood Risk
  • Heat Pump System

Listing and Financial Details

  • Assessor Parcel Number 134-08.00-154.00-1003

Community Details

Overview

  • Property has a Home Owners Association

Recreation

  • Community Pool

Townhouse Details

Home Type

Townhome

Est. Annual Taxes

$1,146

Year Built

Built in 2008

Lot Details

0

Listing Details

  • Property Type: Residential
  • Structure Type: Interior Row/Townhouse
  • Sussex De Quadrants: Between Rt 1 & 113
  • Ownership: Condominium
  • Federal Flood Insurance: Yes
  • Historic: No
  • Inclusions: Furnished
  • New Construction: No
  • Federal Flood Zone: Yes
  • Year Built: 2008
  • Special Features: None
  • Property Sub Type: Townhouses
  • Stories: 3

Interior Features

  • Appliances: Dishwasher, Disposal, Dryer - Electric, Icemaker, Refrigerator, Microwave, Oven - Self Cleaning, Washer
  • Entry Floor: 1
  • Flooring Type: Carpet, Tile/Brick
  • Interior Amenities: Kitchen - Eat-In, Ceiling Fan(s)
  • Window Features: Screens
  • Fireplace Features: Gas/Propane
  • Fireplaces Count: 1
  • Fireplace: Yes
  • Foundation Details: Block
  • Level Count: 3
  • Levels Count: 3+
  • Room Count: 1
  • Room List: Breakfast Room
  • Basement: No

Beds/Baths

  • Bedrooms: 4
  • Total Bathrooms: 4
  • Full Bathrooms: 3
  • Half Bathrooms: 1

Exterior Features

  • Construction Materials: Stick Built, Vinyl Siding
  • Construction Completed: Yes
  • Roof: Architectural Shingle
  • View: Canal
  • Water Access: Yes
  • Water Body Type: Canal
  • Waterfront: Yes
  • Water Oriented: Yes
  • Pool: Yes - Community
  • Water View: Yes

Garage/Parking

  • Garage: Yes
  • Type Of Parking: Attached Garage

Utilities

  • Central Air Conditioning: No
  • Cooling Type: Heat Pump(s)
  • Heating Type: Heat Pump(s)
  • Heating: Yes
  • Sewer/Septic System: Public Sewer
  • Water Source: Public

Condo/Co-op/Association

  • Condo Co-Op Association: Yes
  • Condo Co-Op Fee: 3580.00
  • HOA Condo Co-Op Amenities: Pool - Outdoor, Swimming Pool
  • HOA: No

Schools

  • School District: INDIAN RIVER
  • School District Key: 300200396898

Lot Info

  • Lot Features: Cleared
  • Outdoor Living Structures: Balcony

Rental Info

  • Furnished: Yes
  • Vacation Rental: No

Tax Info

  • Assessor Parcel Number: 134-08.00-154.00-1003
  • County Tax Payment Frequency: Annually
  • Close Date: 11/16/2012

Range of Values:

Collateral Analytics

Collateral Analytics Collateral Analytics AVMs (Automated Valuation Model) employ a number of statistical approaches combined with neighborhood-specific comparable selection guarantees the most up-to-date and precise valuations.

Not Available

Collateral Analytics does not have data for the current month. Please view the chart for historical values.

ICE

ICE Mortgage Technology ICE Mortgage Technology’s AVM (Automated Valuation Model) is a state-of-the-art online residential property valuation tool that provides a quick and accurate estimate of the value of almost any home in the U.S.

Not Available

ICE Mortgage Technology does not have data for the current month. Please view the chart for historical values.

First American

First American First American Data & Analytics’ next-generation AVM combines unrivaled data assets with a blended ensemble of valuation models to produce highly accurate, reliable valuations you can trust.

Not Available

First American does not have data for the current month. Please view the chart for historical values.

Quantarium

Quantarium Quantarium’s valuation service, repeatedly proven the industry’s most accurate and comprehensive, is supercharged with a self-learning and auto-tuning AI engine that continually becomes smarter and more accurate as it processes daily inputs from the industry’s leading RE data lake.

Not Available

Quantarium does not have data for the current month. Please view the chart for historical values.

Average Value
Not Available
List Price
Sold Price
Create a Home Valuation Report for This Property
The Home Valuation Report is an in-depth analysis detailing your home's value as well as a comparison with similar homes in the area

Home Values in the Area

Source: Public Records

Average Home Value in this Area


Source: Public Records

Property History

Date Event Price List to Sale Price per Sq Ft
11/16/2012 11/16/12 Sold $449,688 -21.0% --
10/24/2012 10/24/12 Pending -- -- --
05/24/2011 05/24/11 For Sale $569,000 -- --
Source: Bright MLS

Tax History Compared to Growth

Source: Public Records

Tax History

Year Tax Paid Tax Assessment Tax Assessment Total Assessment is a certain percentage of the fair market value that is determined by local assessors to be the total taxable value of land and additions on the property. Land Improvement
2025 $1,146 $34,050 $0 $34,050
2024 $1,505 $34,050 $0 $34,050
2023 $1,506 $34,050 $0 $34,050
2022 $1,482 $34,050 $0 $34,050
2021 $1,438 $34,050 $0 $34,050
2020 $1,391 $34,050 $0 $34,050
2019 $1,385 $34,050 $0 $34,050
2018 $1,417 $36,650 $0 $0
2017 $1,428 $36,650 $0 $0
2016 $1,309 $38,050 $0 $0
2015 $1,335 $37,650 $0 $0
2014 $1,320 $37,800 $0 $0
Source: Public Records

Agents Affiliated with this Home

  • Section Image
  • Section Image
See All Agents

Map

Source: Bright MLS

MLS Number: 1001208848

Bright MLS

APN: 134-08.00-154.00-1003