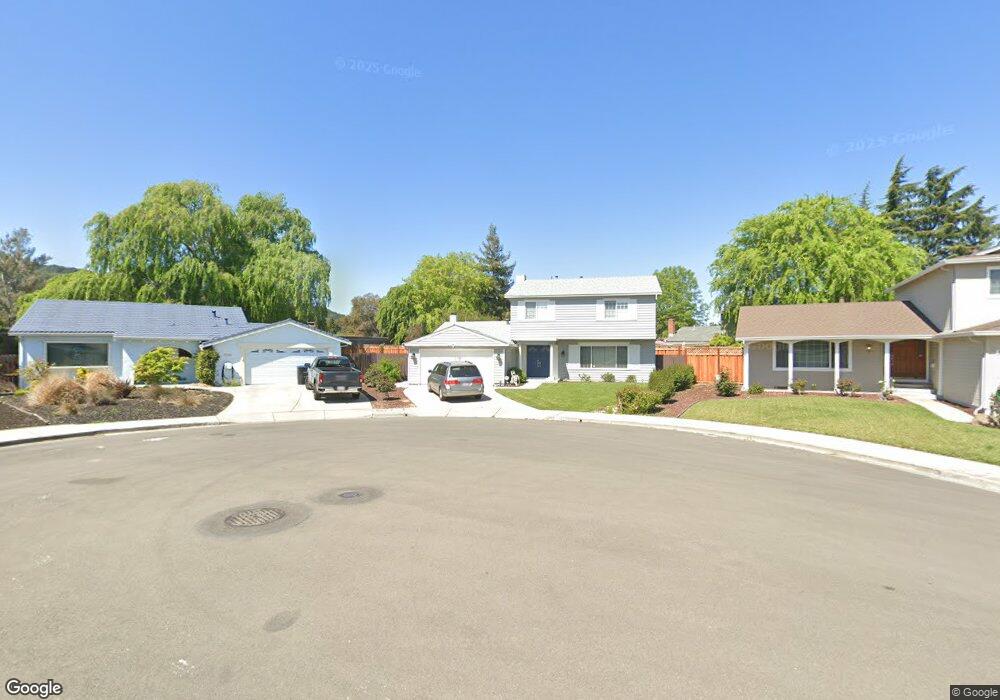
3769 Rocky Mountain Ct Pleasanton, CA 94588
Valley Trails NeighborhoodEstimated Value: $1,482,000 - $1,579,932
4
Beds
3
Baths
1,835
Sq Ft
$842/Sq Ft
Est. Value
About This Home
This home is located at 3769 Rocky Mountain Ct, Pleasanton, CA 94588 and is currently estimated at $1,545,983, approximately $842 per square foot. 3769 Rocky Mountain Ct is a home located in Alameda County with nearby schools including Donlon Elementary School, Thomas S. Hart Middle School, and Foothill High School.
Ownership History
Date
Name
Owned For
Owner Type
Purchase Details
Closed on
Mar 22, 2020
Sold by
Muniswamy Somashekar and Somashekar Rekha
Bought by
Muniswamy Somashekar and Somashekar Rekha
Current Estimated Value
Purchase Details
Closed on
Jan 30, 2017
Sold by
Monarch Ventures Inc
Bought by
Muniswamy Somashekar and Somashekar Rekha
Home Financials for this Owner
Home Financials are based on the most recent Mortgage that was taken out on this home.
Original Mortgage
$720,000
Outstanding Balance
$586,206
Interest Rate
3.62%
Mortgage Type
Adjustable Rate Mortgage/ARM
Estimated Equity
$959,777
Purchase Details
Closed on
Oct 19, 2016
Sold by
Amaya Robert and Amaya Adrianne
Bought by
Monarch Ventures Inc
Home Financials for this Owner
Home Financials are based on the most recent Mortgage that was taken out on this home.
Original Mortgage
$750,000
Interest Rate
3.5%
Mortgage Type
Purchase Money Mortgage
Create a Home Valuation Report for This Property
The Home Valuation Report is an in-depth analysis detailing your home's value as well as a comparison with similar homes in the area
Home Values in the Area
Average Home Value in this Area
Purchase History
| Date | Buyer | Sale Price | Title Company |
|---|---|---|---|
| Muniswamy Somashekar | -- | None Available | |
| Muniswamy Somashekar | $910,000 | Cornerstone Title Company | |
| Monarch Ventures Inc | $678,000 | Cornerstone Title Company |
Source: Public Records
Mortgage History
| Date | Status | Borrower | Loan Amount |
|---|---|---|---|
| Open | Muniswamy Somashekar | $720,000 | |
| Previous Owner | Monarch Ventures Inc | $750,000 |
Source: Public Records
Tax History Compared to Growth
Tax History
| Year | Tax Paid | Tax Assessment Tax Assessment Total Assessment is a certain percentage of the fair market value that is determined by local assessors to be the total taxable value of land and additions on the property. | Land | Improvement |
|---|---|---|---|---|
| 2025 | $12,201 | $1,056,108 | $316,832 | $739,276 |
| 2024 | $12,201 | $1,035,406 | $310,622 | $724,784 |
| 2023 | $12,062 | $1,015,104 | $304,531 | $710,573 |
| 2022 | $11,427 | $995,202 | $298,560 | $696,642 |
| 2021 | $11,135 | $975,692 | $292,707 | $682,985 |
| 2020 | $10,993 | $965,691 | $289,707 | $675,984 |
| 2019 | $11,128 | $946,763 | $284,029 | $662,734 |
| 2018 | $10,903 | $928,200 | $278,460 | $649,740 |
| 2017 | $9,119 | $780,000 | $234,000 | $546,000 |
| 2016 | $3,561 | $326,550 | $97,965 | $228,585 |
| 2015 | $3,494 | $321,645 | $96,493 | $225,152 |
| 2014 | $3,554 | $315,346 | $94,604 | $220,742 |
Source: Public Records
Map
Nearby Homes
- 3636 Shenandoah Ct
- 7444 Pecan Ct
- 3162 Paseo Robles
- 3702 Gettysburg Ct N
- 3110 Paseo Robles
- 6450 Calle Esperanza
- 7758 Forsythia Ct
- 3530 Carlsbad Ct
- 4336 Muirwood Dr
- 7606 Desertwood Ln
- 5988 Corte Cerritos
- 6083 Corte Montanas
- 4421 Muirwood Dr
- 6056 Corte Encinas
- 6355 Singletree Way
- 4504 Muirwood Dr
- 5995 Via Del Cielo
- 6686 Via San Blas
- 2545 Corte Rivera
- 4205 Dorman Rd
- 3785 Rocky Mountain Ct
- 3753 Rocky Mountain Ct
- 3868 Hot Springs Ct
- 3894 Hot Springs Ct
- 3737 Rocky Mountain Ct
- 3842 Hot Springs Ct
- 3788 Rocky Mountain Ct
- 3772 Rocky Mountain Ct
- 3756 Rocky Mountain Ct
- 3740 Rocky Mountain Ct
- 3721 Rocky Mountain Ct
- 3816 Hot Springs Ct
- 3891 Hot Springs Ct
- 3673 Shenandoah Ct
- 3724 Rocky Mountain Ct
- 3865 Hot Springs Ct
- 3665 Shenandoah Ct
- 3839 Hot Springs Ct
- 3657 Shenandoah Ct
- 3681 Shenandoah Ct