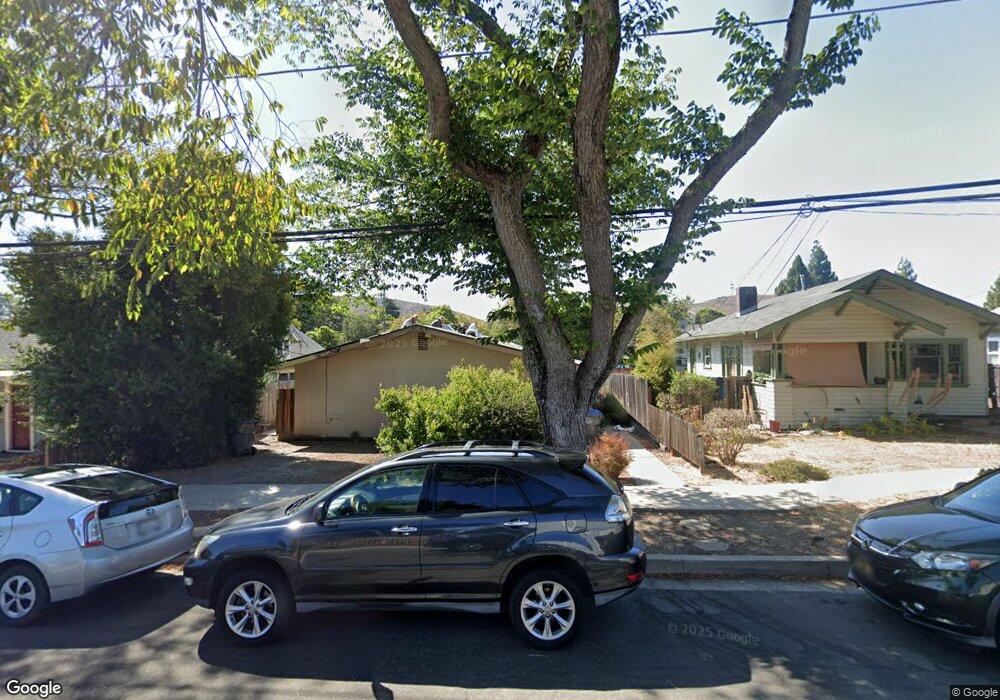
377 Branch St San Luis Obispo, CA 93401
Higuera NeighborhoodEstimated Value: $522,471 - $1,520,000
6
Beds
3
Baths
2,264
Sq Ft
$508/Sq Ft
Est. Value
About This Home
This home is located at 377 Branch St, San Luis Obispo, CA 93401 and is currently estimated at $1,149,118, approximately $507 per square foot. 377 Branch St is a home located in San Luis Obispo County with nearby schools including Laguna Middle School, San Luis Obispo High School, and San Luis Obispo Classical Academy.
Ownership History
Date
Name
Owned For
Owner Type
Purchase Details
Closed on
Dec 10, 2012
Sold by
Lindgren Mark Edward and Lindgren Susan Amanda
Bought by
Lindgren Erik C and Baerg Michelle
Current Estimated Value
Home Financials for this Owner
Home Financials are based on the most recent Mortgage that was taken out on this home.
Original Mortgage
$180,000
Outstanding Balance
$124,593
Interest Rate
3.35%
Mortgage Type
Seller Take Back
Estimated Equity
$1,024,525
Purchase Details
Closed on
Nov 12, 2009
Sold by
Lindgren Mark E and Lindgren Susan A
Bought by
Lindgren Mark Edward and Lindgren Susan Amanda
Create a Home Valuation Report for This Property
The Home Valuation Report is an in-depth analysis detailing your home's value as well as a comparison with similar homes in the area
Home Values in the Area
Average Home Value in this Area
Purchase History
| Date | Buyer | Sale Price | Title Company |
|---|---|---|---|
| Lindgren Erik C | $220,000 | Fidelity National Title Co | |
| Lindgren Mark Edward | -- | None Available |
Source: Public Records
Mortgage History
| Date | Status | Borrower | Loan Amount |
|---|---|---|---|
| Open | Lindgren Erik C | $180,000 |
Source: Public Records
Tax History Compared to Growth
Tax History
| Year | Tax Paid | Tax Assessment Tax Assessment Total Assessment is a certain percentage of the fair market value that is determined by local assessors to be the total taxable value of land and additions on the property. | Land | Improvement |
|---|---|---|---|---|
| 2025 | $3,828 | $304,748 | $105,133 | $199,615 |
| 2024 | $3,768 | $298,773 | $103,072 | $195,701 |
| 2023 | $3,768 | $292,915 | $101,051 | $191,864 |
| 2022 | $3,546 | $287,172 | $99,070 | $188,102 |
| 2021 | $3,460 | $281,542 | $97,128 | $184,414 |
| 2020 | $3,423 | $278,657 | $96,133 | $182,524 |
| 2019 | $3,376 | $273,195 | $94,249 | $178,946 |
| 2018 | $3,319 | $267,839 | $92,401 | $175,438 |
| 2017 | $3,250 | $262,589 | $90,590 | $171,999 |
| 2016 | $3,062 | $257,441 | $88,814 | $168,627 |
| 2015 | $2,718 | $253,575 | $87,480 | $166,095 |
| 2014 | $2,647 | $248,609 | $85,767 | $162,842 |
Source: Public Records
Map
Nearby Homes
- 145 South St Unit a44
- 145 South St Unit c2
- 145 South St Unit A21
- 145 South St Unit A-27
- 145 South St Unit A41
- 145 South St Unit A28
- 1407 Beach St
- 2357 Banderola Ct
- 274 Higuera St Unit 8
- 274 Higuera St Unit 9
- 274 Higuera St Unit 17
- 717 Islay St
- 2418 Cumbre Ct
- 171 Brook St
- 581 Higuera St Unit 308
- 581 Higuera St Unit 207
- 581 Higuera St Unit 302
- 581 Higuera St Unit 301
- 581 Higuera St Unit 201
- 581 Higuera St Unit 307
- 385 Branch St
- 371 Branch St
- 397 Branch St
- 367 Branch St
- 403 Branch St
- 365 Branch St
- 2143 Harris St
- 391 South St
- 395 South St
- 387 South St
- 385 South St
- 413 Branch St
- 353 Branch St
- 2137 Harris St
- 2144 Price St
- 421 Branch St
- 2220 Exposition Dr Unit 49
- 2220 Exposition Dr Unit 50
- 2220 Exposition Dr Unit 99