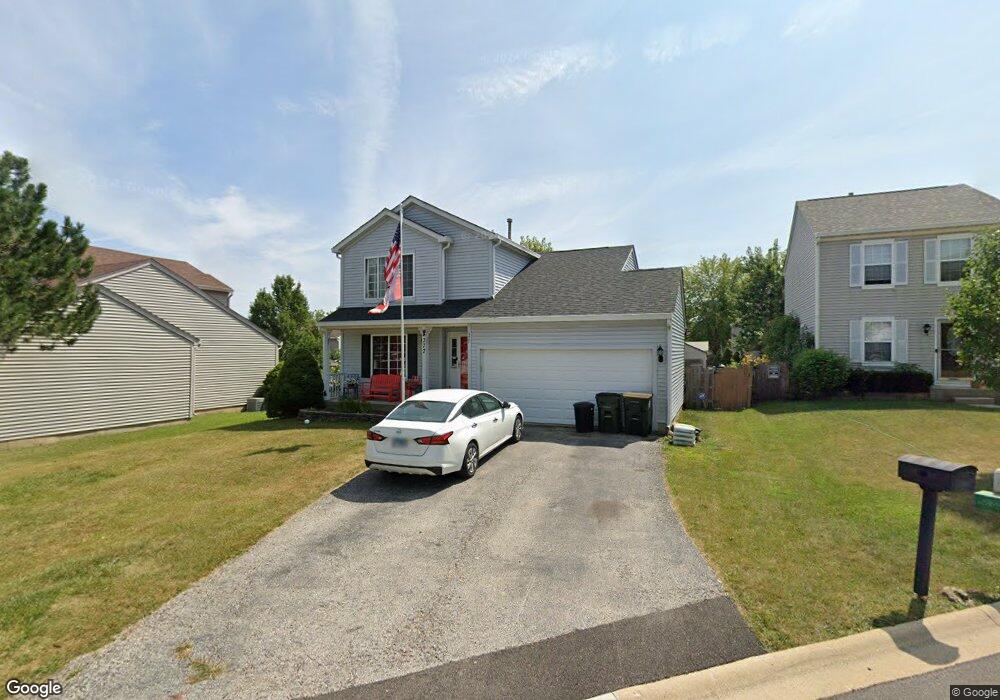
377 E Stanton Ct Unit 7 Round Lake Beach, IL 60073
Estimated Value: $313,000 - $329,481
3
Beds
2
Baths
1,546
Sq Ft
$207/Sq Ft
Est. Value
About This Home
This home is located at 377 E Stanton Ct Unit 7, Round Lake Beach, IL 60073 and is currently estimated at $320,120, approximately $207 per square foot. 377 E Stanton Ct Unit 7 is a home located in Lake County with nearby schools including Indian Hill Elementary School, Round Lake Middle School, and Round Lake High School.
Ownership History
Date
Name
Owned For
Owner Type
Purchase Details
Closed on
Jan 14, 2003
Sold by
Garchie Michael D and Garchie Elizabeth O
Bought by
Molinaro Rodney A and Molinaro Ann M
Current Estimated Value
Home Financials for this Owner
Home Financials are based on the most recent Mortgage that was taken out on this home.
Original Mortgage
$160,050
Interest Rate
5.94%
Purchase Details
Closed on
Sep 3, 1998
Sold by
Sutton Development Inc
Bought by
Garchie Michael D and Garchie Elizabeth O
Home Financials for this Owner
Home Financials are based on the most recent Mortgage that was taken out on this home.
Original Mortgage
$140,900
Interest Rate
7.06%
Mortgage Type
FHA
Create a Home Valuation Report for This Property
The Home Valuation Report is an in-depth analysis detailing your home's value as well as a comparison with similar homes in the area
Home Values in the Area
Average Home Value in this Area
Purchase History
| Date | Buyer | Sale Price | Title Company |
|---|---|---|---|
| Molinaro Rodney A | $165,000 | -- | |
| Garchie Michael D | $144,000 | Ticor Title |
Source: Public Records
Mortgage History
| Date | Status | Borrower | Loan Amount |
|---|---|---|---|
| Previous Owner | Molinaro Rodney A | $160,050 | |
| Previous Owner | Garchie Michael D | $140,900 | |
| Closed | Garchie Michael D | $5,636 |
Source: Public Records
Tax History
| Year | Tax Paid | Tax Assessment Tax Assessment Total Assessment is a certain percentage of the fair market value that is determined by local assessors to be the total taxable value of land and additions on the property. | Land | Improvement |
|---|---|---|---|---|
| 2024 | $7,580 | $95,001 | $15,346 | $79,655 |
| 2023 | $6,608 | $83,938 | $13,559 | $70,379 |
| 2022 | $6,608 | $70,767 | $9,652 | $61,115 |
| 2021 | $6,802 | $65,738 | $8,966 | $56,772 |
| 2020 | $6,750 | $63,632 | $8,679 | $54,953 |
| 2019 | $6,582 | $61,155 | $8,341 | $52,814 |
| 2018 | $7,082 | $57,517 | $9,328 | $48,189 |
| 2017 | $7,055 | $55,983 | $9,079 | $46,904 |
| 2016 | $7,044 | $53,716 | $8,711 | $45,005 |
| 2015 | $7,039 | $50,169 | $8,136 | $42,033 |
| 2014 | $6,015 | $46,772 | $8,096 | $38,676 |
| 2012 | $5,588 | $46,998 | $8,135 | $38,863 |
Source: Public Records
Map
Nearby Homes
- 389 E Cherry Cove Ln
- 2493 N Orchard Ln
- 233 Wildflower Ln
- 2509 N Pennwood Ct
- 49 W Dahlia Ln
- 116 E Monaville Rd
- 2010 N Nicole Ln
- 2190 N Heartland Path
- 1998 N Karen Ln
- 0 E Rollins Rd Unit MRD12394662
- 8 E Rollins Rd
- 1985 Carl Dr
- 36719 N Lawrence Dr
- 2220 N Hillcrest Ct
- 233 E Hawthorne Dr
- 1614 North Ave
- 325 Cedar Ridge Dr
- 2487 Bridle Cir
- 1317 N Cedar Lake Rd
- 0 W Rollins Rd
- 369 E Stanton Ct
- 385 E Stanton Ct
- 2276 N Silver Oaks Dr
- 363 E Stanton Ct
- 393 E Stanton Ct
- 2266 N Silver Oaks Dr
- 2255 N Sedgefield Ct
- 355 E Stanton Ct
- 2261 N Sedgefield Ct
- 2258 N Silver Oaks Dr
- 378 E Stanton Ct
- 370 E Stanton Ct
- 386 E Stanton Ct
- 2262 N Sedgefield Ct
- 362 E Stanton Ct
- 2249 N Sedgefield Ct Unit 7
- 394 E Stanton Ct
- 349 E Stanton Ct
- 2246 N Silver Oaks Dr
- 343 E Stanton Ct
Your Personal Tour Guide
Ask me questions while you tour the home.