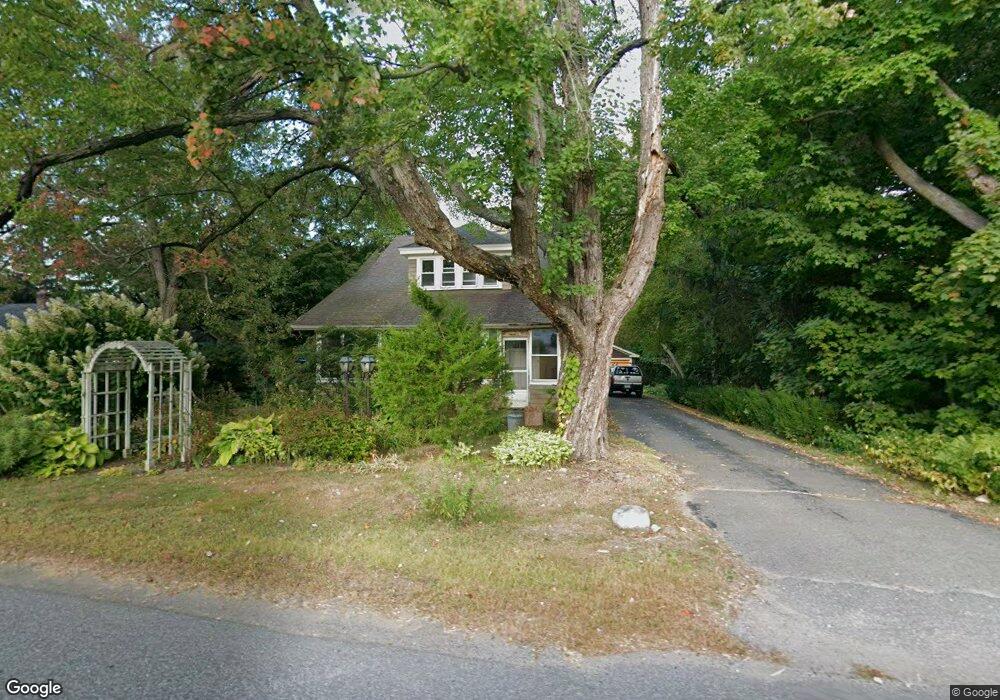
377 East St Easthampton, MA 01027
Estimated Value: $386,000 - $542,000
3
Beds
3
Baths
1,722
Sq Ft
$267/Sq Ft
Est. Value
About This Home
This home is located at 377 East St, Easthampton, MA 01027 and is currently estimated at $459,878, approximately $267 per square foot. 377 East St is a home located in Hampshire County with nearby schools including Easthampton High School, Hilltown Cooperative Charter Public School, and Tri-County Schools.
Ownership History
Date
Name
Owned For
Owner Type
Purchase Details
Closed on
Dec 26, 2003
Sold by
Ogulewicz Joanne B
Bought by
Ogulewicz Peter J
Current Estimated Value
Purchase Details
Closed on
Sep 18, 1997
Sold by
Battles Elizabeth M and Rhodes Ruth P
Bought by
Ogulewicz Joanne B and Ogulewicz Peter J
Home Financials for this Owner
Home Financials are based on the most recent Mortgage that was taken out on this home.
Original Mortgage
$69,000
Interest Rate
7.38%
Mortgage Type
Purchase Money Mortgage
Create a Home Valuation Report for This Property
The Home Valuation Report is an in-depth analysis detailing your home's value as well as a comparison with similar homes in the area
Home Values in the Area
Average Home Value in this Area
Purchase History
| Date | Buyer | Sale Price | Title Company |
|---|---|---|---|
| Ogulewicz Peter J | -- | -- | |
| Ogulewicz Joanne B | $92,000 | -- |
Source: Public Records
Mortgage History
| Date | Status | Borrower | Loan Amount |
|---|---|---|---|
| Open | Ogulewicz Joanne B | $105,000 | |
| Previous Owner | Ogulewicz Joanne B | $103,000 | |
| Previous Owner | Ogulewicz Joanne B | $69,000 | |
| Closed | Ogulewicz Joanne B | $13,000 |
Source: Public Records
Tax History Compared to Growth
Tax History
| Year | Tax Paid | Tax Assessment Tax Assessment Total Assessment is a certain percentage of the fair market value that is determined by local assessors to be the total taxable value of land and additions on the property. | Land | Improvement |
|---|---|---|---|---|
| 2025 | $5,141 | $376,100 | $112,800 | $263,300 |
| 2024 | $4,968 | $366,400 | $109,600 | $256,800 |
| 2023 | $4,139 | $282,500 | $86,500 | $196,000 |
| 2022 | $4,670 | $282,500 | $86,500 | $196,000 |
| 2021 | $4,688 | $267,300 | $86,500 | $180,800 |
| 2020 | $5,017 | $282,500 | $86,500 | $196,000 |
| 2019 | $4,109 | $265,800 | $86,500 | $179,300 |
| 2018 | $3,970 | $248,100 | $81,700 | $166,400 |
| 2017 | $3,877 | $239,200 | $78,400 | $160,800 |
| 2016 | $3,701 | $237,400 | $78,400 | $159,000 |
| 2015 | $3,597 | $237,400 | $78,400 | $159,000 |
Source: Public Records
Map
Nearby Homes
- 108 Parsons St
- 2 Clinton St
- 98 Everett St
- 33 Knipfer Ave
- 52-54 Everett St
- 78 Holyoke St
- 12 Glen Cove Place Unit B
- 10 Glen Cove Place Unit A
- 19 Nicols Way Unit 19
- 52 Williston Ave
- 5 Lownds Ave
- 125 Park St
- 38 West St
- 6 S St & Abutting Lots
- 41 South St Unit 11
- 385 Main St
- 33 Howard Ave
- M143 &152 Glendale St
- 245 Park St
- 16 Bayberry Dr