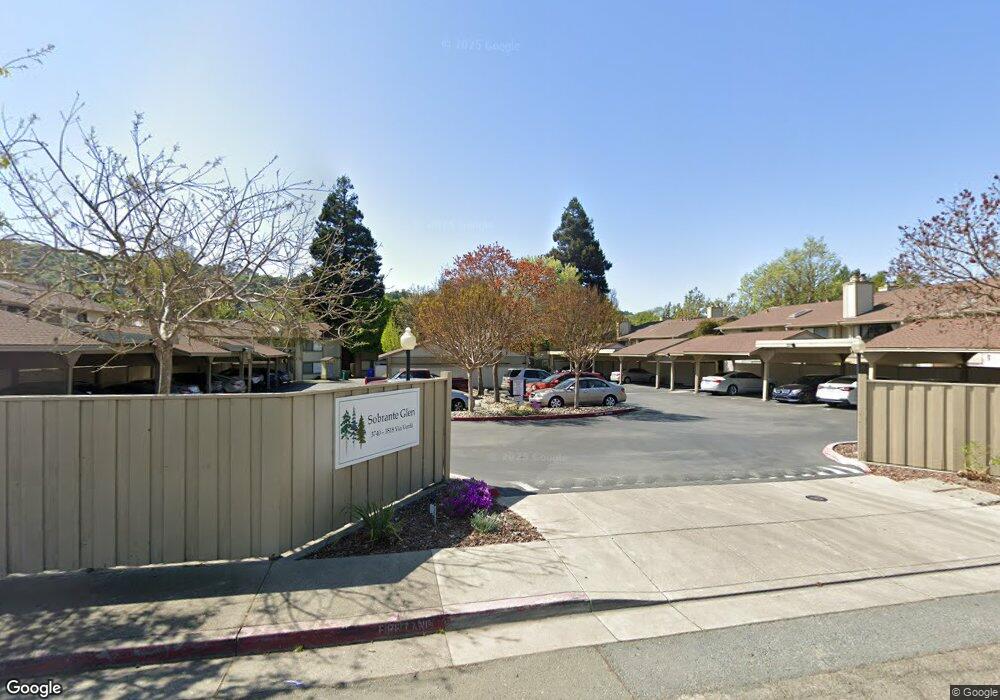
3770 Via Verdi El Sobrante, CA 94803
Estimated Value: $381,334 - $442,000
2
Beds
1
Bath
1,125
Sq Ft
$365/Sq Ft
Est. Value
About This Home
This home is located at 3770 Via Verdi, El Sobrante, CA 94803 and is currently estimated at $410,084, approximately $364 per square foot. 3770 Via Verdi is a home located in Contra Costa County with nearby schools including Sheldon Elementary School, Betty Reid Soskin Middle School, and De Anza Senior High School.
Ownership History
Date
Name
Owned For
Owner Type
Purchase Details
Closed on
Jul 19, 2019
Sold by
Clements Shelly A and Broglio Chris
Bought by
Broglio Chris James and Clements Shelly Ann
Current Estimated Value
Purchase Details
Closed on
Oct 26, 2012
Sold by
Clemets Shelly A and Broglio Chris
Bought by
Clements Shelly A and Broglio Chris
Home Financials for this Owner
Home Financials are based on the most recent Mortgage that was taken out on this home.
Original Mortgage
$153,978
Outstanding Balance
$106,603
Interest Rate
3.43%
Mortgage Type
New Conventional
Estimated Equity
$303,481
Purchase Details
Closed on
Jun 17, 1999
Sold by
Anne Rock Virginia and Anne Virginia
Bought by
Clements Shelly A
Home Financials for this Owner
Home Financials are based on the most recent Mortgage that was taken out on this home.
Original Mortgage
$102,532
Interest Rate
7.01%
Mortgage Type
FHA
Create a Home Valuation Report for This Property
The Home Valuation Report is an in-depth analysis detailing your home's value as well as a comparison with similar homes in the area
Home Values in the Area
Average Home Value in this Area
Purchase History
| Date | Buyer | Sale Price | Title Company |
|---|---|---|---|
| Broglio Chris James | -- | Old Republic Title | |
| Clements Shelly A | -- | Old Republic Title Company | |
| Clements Shelly A | $105,000 | First American Title Guarant |
Source: Public Records
Mortgage History
| Date | Status | Borrower | Loan Amount |
|---|---|---|---|
| Open | Clements Shelly A | $153,978 | |
| Closed | Clements Shelly A | $102,532 | |
| Closed | Clements Shelly A | $5,250 |
Source: Public Records
Tax History Compared to Growth
Tax History
| Year | Tax Paid | Tax Assessment Tax Assessment Total Assessment is a certain percentage of the fair market value that is determined by local assessors to be the total taxable value of land and additions on the property. | Land | Improvement |
|---|---|---|---|---|
| 2025 | $3,256 | $164,583 | $6,099 | $158,484 |
| 2024 | $3,275 | $161,357 | $5,980 | $155,377 |
| 2023 | $3,275 | $158,194 | $5,863 | $152,331 |
| 2022 | $3,217 | $155,094 | $5,749 | $149,345 |
| 2021 | $3,182 | $152,054 | $5,637 | $146,417 |
| 2019 | $4,120 | $147,546 | $5,471 | $142,075 |
| 2018 | $2,975 | $144,654 | $5,364 | $139,290 |
| 2017 | $2,882 | $141,818 | $5,259 | $136,559 |
| 2016 | $2,810 | $139,038 | $5,156 | $133,882 |
| 2015 | $2,770 | $136,950 | $5,079 | $131,871 |
| 2014 | $2,749 | $134,268 | $4,980 | $129,288 |
Source: Public Records
Map
Nearby Homes
- 3760 Via Verdi
- 3764 Via Verdi Unit 13
- 4047 Mozart Dr
- 0 Montera Ct
- 3706 Montera Ct
- 4091 Garden Rd
- 4022 San Pablo Dam Rd
- 3034 Parker Rd
- 57 Parkview Terrace
- 10 Dove Ln
- 3275 Annapolis Ave
- 3944 La Cima Rd
- 3027 Colette Dr
- 6253 Bayview Ave
- 6324 Bonita Ct
- 742 Alhambra Rd
- 0 Barth Ave
- 3122 Groom Dr
- 3123 Moyers Rd
- 4370 Wesley Way
- 3768 Via Verdi
- 3766 Via Verdi
- 3762 Via Verdi
- 3772 Via Verdi
- 3774 Via Verdi
- 3756 Via Verdi
- 3776 Via Verdi Unit 1
- 3776 Via Verdi
- 3758 Via Verdi
- 3778 Via Verdi Unit 20
- 3782 Via Verdi Unit 22
- 3780 Via Verdi Unit 21
- 3816 Via Verdi
- 3786 Via Verdi Unit 24
- 3754 Via Verdi Unit 8
- 3752 Via Verdi
- 3784 Via Verdi
- 3750 Via Verdi Unit 6
- 3748 Via Verdi Unit 30
- 3746 Via Verdi Unit 4