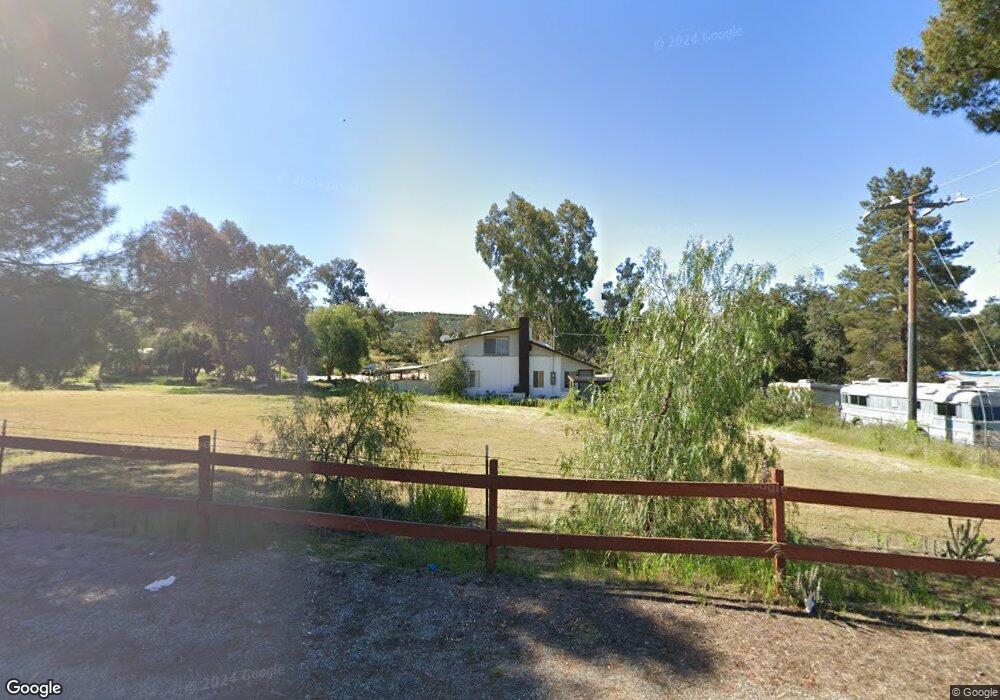
37711 E Benton Rd Temecula, CA 92592
Estimated Value: $335,000 - $587,000
3
Beds
2
Baths
1,118
Sq Ft
$451/Sq Ft
Est. Value
About This Home
This home is located at 37711 E Benton Rd, Temecula, CA 92592 and is currently estimated at $504,135, approximately $450 per square foot. 37711 E Benton Rd is a home located in Riverside County with nearby schools including Crowne Hill Elementary School, Temecula Middle School, and Temecula Valley High School.
Ownership History
Date
Name
Owned For
Owner Type
Purchase Details
Closed on
Dec 28, 2024
Sold by
Slowik William D
Bought by
Slowik Paul and Slowik Joe E
Current Estimated Value
Purchase Details
Closed on
Apr 18, 2013
Sold by
Tcj Enterprises Llc
Bought by
Slowik William D
Home Financials for this Owner
Home Financials are based on the most recent Mortgage that was taken out on this home.
Original Mortgage
$135,000
Interest Rate
3.5%
Mortgage Type
Seller Take Back
Purchase Details
Closed on
Jul 9, 2009
Sold by
T C J Enterprises
Bought by
Tcj Enterprises Llc
Purchase Details
Closed on
Jul 21, 2004
Sold by
Mock Craig L and Mock Jeffrey L
Bought by
Kadota Holly Mock and Mock Jeffrey L
Purchase Details
Closed on
Jun 19, 2000
Sold by
Mock Theodore Trustee and Mock Family Trust
Bought by
Mock Craig L and Mock Jeffrey L
Create a Home Valuation Report for This Property
The Home Valuation Report is an in-depth analysis detailing your home's value as well as a comparison with similar homes in the area
Purchase History
| Date | Buyer | Sale Price | Title Company |
|---|---|---|---|
| Slowik Paul | -- | None Listed On Document | |
| Slowik William D | $150,000 | Nations Title Company Of Ca | |
| Tcj Enterprises Llc | -- | None Available | |
| Kadota Holly Mock | -- | -- | |
| Kadota Holly Mock | -- | -- | |
| Mock Craig L | -- | -- |
Source: Public Records
Mortgage History
| Date | Status | Borrower | Loan Amount |
|---|---|---|---|
| Previous Owner | Slowik William D | $135,000 |
Source: Public Records
Tax History
| Year | Tax Paid | Tax Assessment Tax Assessment Total Assessment is a certain percentage of the fair market value that is determined by local assessors to be the total taxable value of land and additions on the property. | Land | Improvement |
|---|---|---|---|---|
| 2025 | $1,914 | $184,700 | $65,258 | $119,442 |
| 2023 | $1,914 | $177,529 | $62,725 | $114,804 |
| 2022 | $1,862 | $174,049 | $61,496 | $112,553 |
| 2021 | $1,826 | $170,638 | $60,291 | $110,347 |
| 2020 | $1,808 | $168,889 | $59,673 | $109,216 |
| 2019 | $1,783 | $165,578 | $58,503 | $107,075 |
| 2018 | $1,751 | $162,332 | $57,356 | $104,976 |
| 2017 | $1,721 | $159,150 | $56,232 | $102,918 |
| 2016 | $1,687 | $156,030 | $55,130 | $100,900 |
| 2015 | $1,657 | $153,688 | $54,302 | $99,386 |
| 2014 | $1,608 | $150,680 | $53,240 | $97,440 |
Source: Public Records
Map
Nearby Homes
- 0 Grande Rd
- 36880 E Benton Rd
- 19 Remuda Dr
- 38595 Carolbee Ln
- 37565 Purdue
- 38101 Via Lobato
- 0 Remuda Dr Unit SW25224807
- 38125 Camino Sierra Rd
- 38125 Overhill Rd
- 37450 Downey Rd
- 38538 Martin Ranch Rd
- 1 Quail Dr
- 38662 E Benton Rd
- 38975 Vista Dawn
- 1 Spring Valley Rd
- 41425 Vía Del Toronjo
- 41280 De Portola Rd
- 36555 Summitville St
- 39339 Calle Conejo
- 38595 Via Del Oso
- 37711 E Benton Rd Unit Master Bedroom and shared kitchen
- 37641 E Benton Rd
- 0 E Benton Rd Unit SW18133398
- 0 E Benton Rd Unit SW18100301
- 0 E Benton Rd Unit T08039376
- 0 E Benton Rd Unit T09107138
- 0 E Benton Rd Unit T09113403
- 0 E Benton Rd Unit SW17229716
- 0 E Benton Rd Unit T11056033
- 0 E Benton Rd Unit T12118001
- 0 E Benton Rd Unit SW13054423
- 0 E Benton Rd Unit SW14063659
- 0 E Benton Rd Unit SW14063689
- 0 E Benton Rd Unit SW14063397
- 0 E Benton Rd Unit SW14072237
- 0 E Benton Rd Unit SW15175536
- 0 E Benton Rd Unit SW16096940
- 0 E Benton Rd Unit SW16167014
- 0 E Benton Rd Unit 130050546
- 0 E Benton Rd Unit 13, 14, 15, 16
Your Personal Tour Guide
Ask me questions while you tour the home.