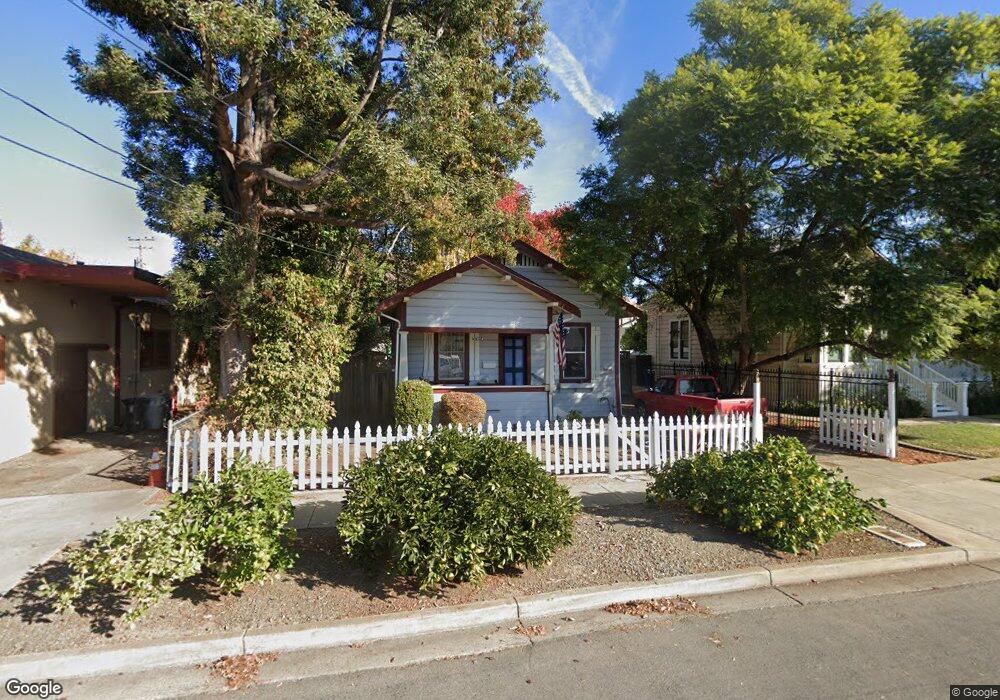
37814 2nd St Fremont, CA 94536
Niles NeighborhoodEstimated Value: $682,000 - $1,423,000
2
Beds
1
Bath
672
Sq Ft
$1,453/Sq Ft
Est. Value
About This Home
This home is located at 37814 2nd St, Fremont, CA 94536 and is currently estimated at $976,453, approximately $1,453 per square foot. 37814 2nd St is a home located in Alameda County with nearby schools including Niles Elementary School, Centerville Junior High School, and Washington High School.
Ownership History
Date
Name
Owned For
Owner Type
Purchase Details
Closed on
Jun 30, 2020
Sold by
Lerma Rosanna
Bought by
Lerma Rosanna and Rosanna Lerma Revocable Trust
Current Estimated Value
Purchase Details
Closed on
Apr 12, 1996
Sold by
Peterson Allen T and Peterson Pamela J
Bought by
Lerma Rosanna
Home Financials for this Owner
Home Financials are based on the most recent Mortgage that was taken out on this home.
Original Mortgage
$144,810
Interest Rate
7.84%
Mortgage Type
Balloon
Create a Home Valuation Report for This Property
The Home Valuation Report is an in-depth analysis detailing your home's value as well as a comparison with similar homes in the area
Home Values in the Area
Average Home Value in this Area
Purchase History
| Date | Buyer | Sale Price | Title Company |
|---|---|---|---|
| Lerma Rosanna | -- | None Available | |
| Lerma Rosanna | $161,000 | American Title Ins Co |
Source: Public Records
Mortgage History
| Date | Status | Borrower | Loan Amount |
|---|---|---|---|
| Closed | Lerma Rosanna | $144,810 |
Source: Public Records
Tax History
| Year | Tax Paid | Tax Assessment Tax Assessment Total Assessment is a certain percentage of the fair market value that is determined by local assessors to be the total taxable value of land and additions on the property. | Land | Improvement |
|---|---|---|---|---|
| 2025 | $3,711 | $260,280 | $80,234 | $187,046 |
| 2024 | $3,711 | $255,039 | $78,660 | $183,379 |
| 2023 | $3,595 | $256,901 | $77,118 | $179,783 |
| 2022 | $3,525 | $244,865 | $75,606 | $176,259 |
| 2021 | $3,444 | $239,927 | $74,124 | $172,803 |
| 2020 | $3,380 | $244,396 | $73,364 | $171,032 |
| 2019 | $3,344 | $239,605 | $71,926 | $167,679 |
| 2018 | $3,275 | $234,908 | $70,516 | $164,392 |
| 2017 | $3,193 | $230,304 | $69,134 | $161,170 |
| 2016 | $3,126 | $225,788 | $67,778 | $158,010 |
| 2015 | $3,073 | $222,398 | $66,761 | $155,637 |
| 2014 | $3,011 | $218,042 | $65,453 | $152,589 |
Source: Public Records
Map
Nearby Homes
- 159 Quiancy Terrance
- 37915 Vallejo St
- 339 I St
- 38016 Vallejo St
- 37230 2nd St
- 118 Sycamore St
- 36930 Niles Blvd
- 711 Old Canyon Rd Unit 6
- 711 Old Canyon Rd Unit 77
- 711 Old Canyon Rd Unit 176
- 711 Old Canyon Rd Unit 103
- 711 Old Canyon Rd Unit SPC 33
- 711 Old Canyon Rd Unit 56
- 111 Overacker Terrace
- 38581 Aventura Terrace
- 77 Barnes Ln
- 38555 Overacker Ave
- 51 Sea Crest Terrace
- 38566 Oliver Way
- 38614 Royal Ann Common
Your Personal Tour Guide
Ask me questions while you tour the home.