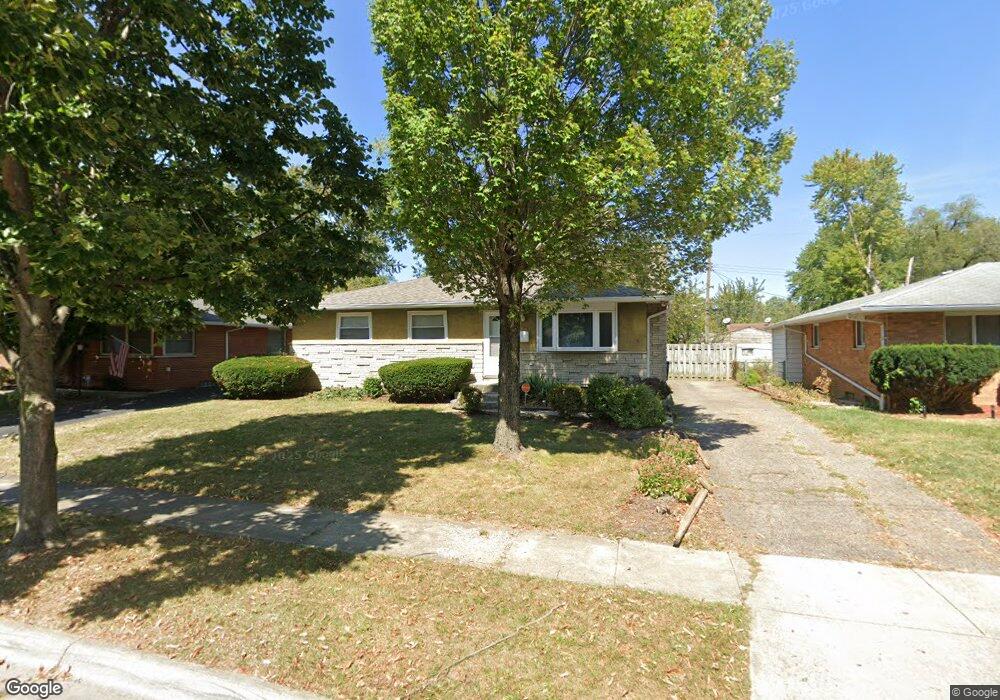
3784 Conway Dr Columbus, OH 43227
Linwood NeighborhoodEstimated Value: $181,298 - $229,000
3
Beds
2
Baths
1,120
Sq Ft
$183/Sq Ft
Est. Value
About This Home
This home is located at 3784 Conway Dr, Columbus, OH 43227 and is currently estimated at $205,325, approximately $183 per square foot. 3784 Conway Dr is a home located in Franklin County with nearby schools including Shady Lane Elementary School, Sherwood Middle School, and Walnut Ridge High School.
Ownership History
Date
Name
Owned For
Owner Type
Purchase Details
Closed on
Nov 12, 2024
Sold by
Bh Shared Ownership I Oh Llc
Bought by
Balance Homes 3Z Llc
Current Estimated Value
Purchase Details
Closed on
Apr 10, 2023
Sold by
Ragland James C
Bought by
Bh Shared Ownership I Oh Llc
Purchase Details
Closed on
Mar 31, 2003
Sold by
Fenderson Nina M and Case #00-54378
Bought by
Ragland James C
Home Financials for this Owner
Home Financials are based on the most recent Mortgage that was taken out on this home.
Original Mortgage
$85,260
Interest Rate
5.95%
Mortgage Type
FHA
Purchase Details
Closed on
Jun 16, 1993
Bought by
Fenderson Nina M
Purchase Details
Closed on
Jan 25, 1993
Create a Home Valuation Report for This Property
The Home Valuation Report is an in-depth analysis detailing your home's value as well as a comparison with similar homes in the area
Home Values in the Area
Average Home Value in this Area
Purchase History
| Date | Buyer | Sale Price | Title Company |
|---|---|---|---|
| Balance Homes 3Z Llc | -- | Clearedge Title | |
| Balance Homes 3Z Llc | -- | Clearedge Title | |
| Bh Shared Ownership I Oh Llc | $89,300 | Blueprint Title Company | |
| Ragland James C | -- | Blueprint Title Company | |
| Ragland James C | $86,000 | Professional Closing Title A | |
| Fenderson Nina M | $62,900 | -- | |
| -- | $39,100 | -- |
Source: Public Records
Mortgage History
| Date | Status | Borrower | Loan Amount |
|---|---|---|---|
| Previous Owner | Ragland James C | $85,260 |
Source: Public Records
Tax History
| Year | Tax Paid | Tax Assessment Tax Assessment Total Assessment is a certain percentage of the fair market value that is determined by local assessors to be the total taxable value of land and additions on the property. | Land | Improvement |
|---|---|---|---|---|
| 2025 | $3,254 | $67,730 | $13,410 | $54,320 |
| 2024 | $3,254 | $67,730 | $13,410 | $54,320 |
| 2023 | $3,001 | $67,730 | $13,410 | $54,320 |
| 2022 | $1,602 | $30,880 | $7,250 | $23,630 |
| 2021 | $1,604 | $30,880 | $7,250 | $23,630 |
| 2020 | $1,607 | $30,880 | $7,250 | $23,630 |
| 2019 | $1,495 | $24,650 | $6,060 | $18,590 |
| 2018 | $1,388 | $24,650 | $6,060 | $18,590 |
| 2017 | $1,455 | $24,650 | $6,060 | $18,590 |
| 2016 | $1,415 | $21,360 | $4,590 | $16,770 |
| 2015 | $1,284 | $21,360 | $4,590 | $16,770 |
| 2014 | $1,288 | $21,360 | $4,590 | $16,770 |
| 2013 | $706 | $23,730 | $5,110 | $18,620 |
Source: Public Records
Map
Nearby Homes
- 3777 E Deshler Ave
- 1792 Bostwick Rd
- 1619 Basil Dr
- 1656 Vilardo Ln
- 3959 Carlton Ave
- 1640 Striebel Rd
- 1666-1668 Carstare Dr
- 3457 Roswell Dr
- 3428 LIV Moor Dr
- 1490 Elaine Rd Unit 1462
- 3622 Cushing Dr Unit C
- 3585 Cushing Dr
- 3355 E Deshler Ave
- 1646 Clyde Place
- 1294 Dellwood Ave
- 4024 Colby Ave
- 1269 Carolwood Ave
- 3325 E Deshler Ave
- 1265 Elderwood Ave
- 1654 Wilton Dr
Your Personal Tour Guide
Ask me questions while you tour the home.