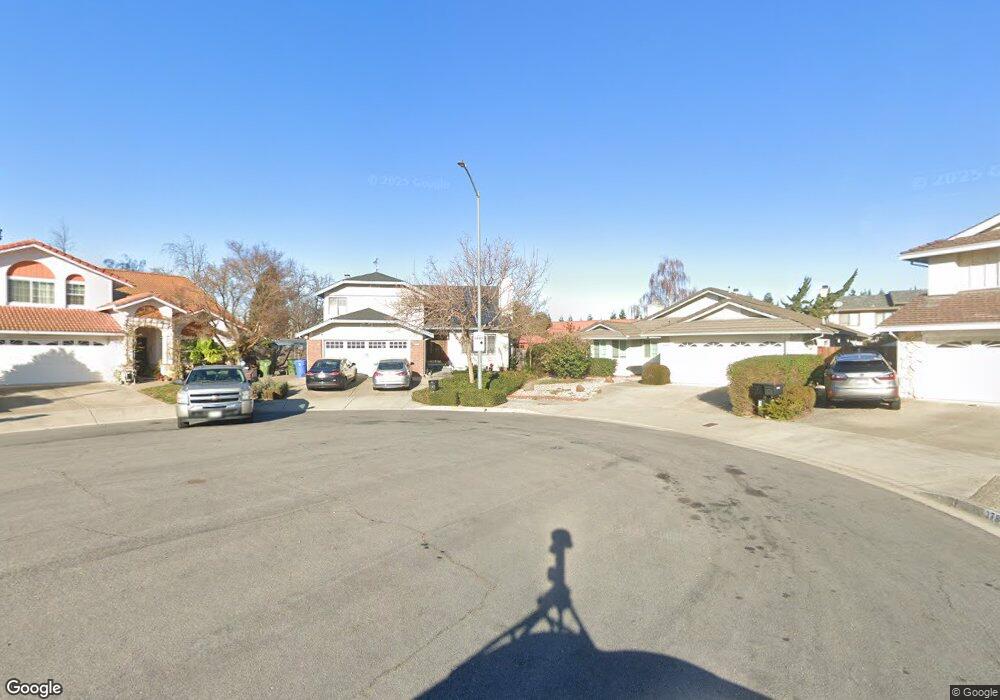
37859 Benchmark Ct Fremont, CA 94536
Parkmont NeighborhoodEstimated Value: $1,959,000 - $2,292,000
4
Beds
3
Baths
2,410
Sq Ft
$870/Sq Ft
Est. Value
About This Home
This home is located at 37859 Benchmark Ct, Fremont, CA 94536 and is currently estimated at $2,096,459, approximately $869 per square foot. 37859 Benchmark Ct is a home located in Alameda County with nearby schools including Parkmont Elementary School, Centerville Junior High School, and Washington High School.
Ownership History
Date
Name
Owned For
Owner Type
Purchase Details
Closed on
Jul 26, 2022
Sold by
Ryan John W and Ryan Sherry B
Bought by
John And Sherry Ryan Living Trust
Current Estimated Value
Purchase Details
Closed on
May 16, 2003
Sold by
Ryan John W and Ryan Sherry B
Bought by
Ryan John W
Home Financials for this Owner
Home Financials are based on the most recent Mortgage that was taken out on this home.
Original Mortgage
$404,000
Interest Rate
5.61%
Mortgage Type
Purchase Money Mortgage
Create a Home Valuation Report for This Property
The Home Valuation Report is an in-depth analysis detailing your home's value as well as a comparison with similar homes in the area
Home Values in the Area
Average Home Value in this Area
Purchase History
| Date | Buyer | Sale Price | Title Company |
|---|---|---|---|
| John And Sherry Ryan Living Trust | -- | Law Office Of Jeremy D Price | |
| Ryan John W | -- | Placer Title Company |
Source: Public Records
Mortgage History
| Date | Status | Borrower | Loan Amount |
|---|---|---|---|
| Previous Owner | Ryan John W | $404,000 |
Source: Public Records
Tax History Compared to Growth
Tax History
| Year | Tax Paid | Tax Assessment Tax Assessment Total Assessment is a certain percentage of the fair market value that is determined by local assessors to be the total taxable value of land and additions on the property. | Land | Improvement |
|---|---|---|---|---|
| 2025 | $6,077 | $473,334 | $183,006 | $297,328 |
| 2024 | $6,077 | $463,918 | $179,419 | $291,499 |
| 2023 | $5,903 | $461,685 | $175,901 | $285,784 |
| 2022 | $5,812 | $445,632 | $172,452 | $280,180 |
| 2021 | $5,672 | $436,758 | $169,071 | $274,687 |
| 2020 | $5,641 | $439,208 | $167,337 | $271,871 |
| 2019 | $5,578 | $430,598 | $164,057 | $266,541 |
| 2018 | $5,467 | $422,155 | $160,840 | $261,315 |
| 2017 | $5,330 | $413,879 | $157,687 | $256,192 |
| 2016 | $5,231 | $405,766 | $154,596 | $251,170 |
| 2015 | $5,154 | $399,672 | $152,274 | $247,398 |
| 2014 | $5,076 | $391,845 | $149,292 | $242,553 |
Source: Public Records
Map
Nearby Homes
- 2579 Bishop Ave
- 37993 Ponderosa Terrace
- 38043 Miller Place
- 38099 Miller Place
- 37637 Canterbury St
- 38228 Paseo Padre Pkwy Unit 24
- 3006 Eggers Dr
- 38101 Cambridge Ct
- 38030 Dundee Common
- 38131 Acacia St
- 37502 Zephyr Terrace
- 37811 Fernwood Ct
- 38455 Bronson St Unit 325
- 38500 Paseo Padre Pkwy Unit 306
- 2755 Country Dr Unit 311
- 1554 Gilbert Place
- 3810 Burton Common
- 3507 Buttonwood Terrace Unit 203
- 3443 Pepperwood Terrace Unit 301
- 3530 Oakwood Terrace Unit 102
- 37873 Benchmark Ct
- 37837 Benchmark Ct
- 2552 Bishop Ave
- 2560 Bishop Ave
- 37814 Tacchella Way
- 2544 Bishop Ave
- 37788 Tacchella Way
- 37887 Benchmark Ct
- 37830 Tacchella Way
- 37854 Benchmark Ct
- 37762 Tacchella Way
- 2536 Bishop Ave
- 37842 Tacchella Way
- 37868 Benchmark Ct
- 37839 Bishop Ct
- 37882 Benchmark Ct
- 37851 Bishop Ct
- 37823 Bishop Ct
- 2555 Bishop Ave
- 2547 Bishop Ave
