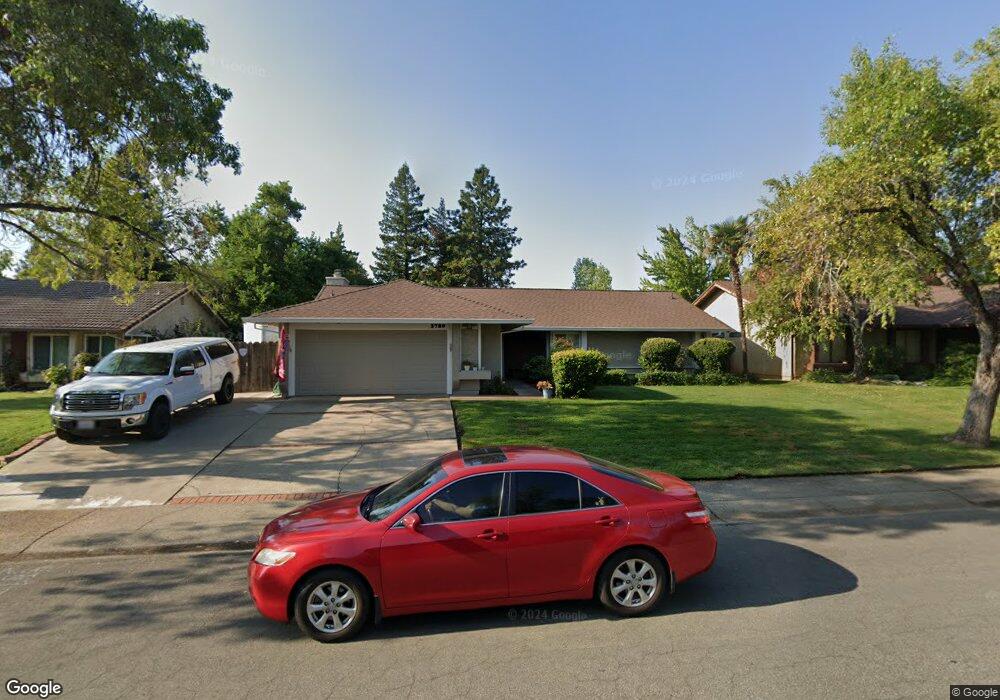
3789 Fujiyama Way Unit 1 Redding, CA 96001
Ridgeview NeighborhoodEstimated Value: $416,000 - $438,000
3
Beds
2
Baths
1,600
Sq Ft
$266/Sq Ft
Est. Value
About This Home
This home is located at 3789 Fujiyama Way Unit 1, Redding, CA 96001 and is currently estimated at $425,329, approximately $265 per square foot. 3789 Fujiyama Way Unit 1 is a home located in Shasta County with nearby schools including Manzanita Elementary School, Sequoia Middle School, and Shasta High School.
Ownership History
Date
Name
Owned For
Owner Type
Purchase Details
Closed on
Jun 26, 2019
Sold by
Richmond James F and Richmond Stacy A
Bought by
Richmond James F and Richmond Stacy A
Current Estimated Value
Purchase Details
Closed on
Apr 6, 2000
Sold by
Sisneros Tanya L
Bought by
Richmond James F and Richmond Stacy A
Purchase Details
Closed on
Oct 26, 1998
Sold by
Fletcher Laidlaw R
Bought by
Sisneros Tanya L
Home Financials for this Owner
Home Financials are based on the most recent Mortgage that was taken out on this home.
Original Mortgage
$119,500
Interest Rate
6.6%
Mortgage Type
FHA
Create a Home Valuation Report for This Property
The Home Valuation Report is an in-depth analysis detailing your home's value as well as a comparison with similar homes in the area
Home Values in the Area
Average Home Value in this Area
Purchase History
| Date | Buyer | Sale Price | Title Company |
|---|---|---|---|
| Richmond James F | -- | None Available | |
| Richmond James F | -- | First American Title Co | |
| Sisneros Tanya L | $120,000 | Fidelity National Title Co |
Source: Public Records
Mortgage History
| Date | Status | Borrower | Loan Amount |
|---|---|---|---|
| Previous Owner | Sisneros Tanya L | $119,500 |
Source: Public Records
Tax History Compared to Growth
Tax History
| Year | Tax Paid | Tax Assessment Tax Assessment Total Assessment is a certain percentage of the fair market value that is determined by local assessors to be the total taxable value of land and additions on the property. | Land | Improvement |
|---|---|---|---|---|
| 2025 | $2,335 | $222,585 | $46,095 | $176,490 |
| 2024 | $2,297 | $218,222 | $45,192 | $173,030 |
| 2023 | $2,297 | $213,944 | $44,306 | $169,638 |
| 2022 | $2,258 | $209,750 | $43,438 | $166,312 |
| 2021 | $2,238 | $205,638 | $42,587 | $163,051 |
| 2020 | $2,264 | $203,531 | $42,151 | $161,380 |
| 2019 | $2,150 | $199,541 | $41,325 | $158,216 |
| 2018 | $2,166 | $195,629 | $40,515 | $155,114 |
| 2017 | $2,151 | $191,794 | $39,721 | $152,073 |
| 2016 | $2,083 | $188,035 | $38,943 | $149,092 |
| 2015 | $2,022 | $185,212 | $38,359 | $146,853 |
| 2014 | $2,038 | $181,585 | $37,608 | $143,977 |
Source: Public Records
Map
Nearby Homes
- 4125 Oro St
- 3811 Andes Dr
- 3380 Placer St
- 4160 Travona Ct
- 1605 Wisconsin Ave
- 1640 Wisconsin Ave
- 1474 Gladstone Ct
- 3357 Oakwood Place
- 1756 Mary Lake Dr
- 1783 Record Ln
- 1355 Bambury Ct
- 3135 Stratford Ave
- 2166 Wicklow St
- 1430 Ridge Dr
- 3060 Monte Bello Dr
- 3036 Monte Bello Dr
- 3261 Misty Glen Dr
- 4692 Corita Place
- 4613 Nantucket Dr
- 1140 Redbud Dr
- 3789 Fujiyama Way
- 3777 Fujiyama Way
- 3801 Fujiyama Way
- 3813 Fujiyama Way
- 3790 Wasatch Dr
- 3765 Fujiyama Way Unit 1
- 3765 Fujiyama Way
- 3810 Wasatch Dr
- 3770 Wasatch Dr
- 3830 Wasatch Dr
- 3750 Wasatch Dr
- 3786 Fujiyama Way Unit 1
- 3786 Fujiyama Way
- 3762 Fujiyama Way
- 3798 Fujiyama Way
- 3774 Fujiyama Way
- 3825 Fujiyama Way
- 3850 Wasatch Dr
- 3810 Fujiyama Way
- 3741 Fujiyama Way Unit 1