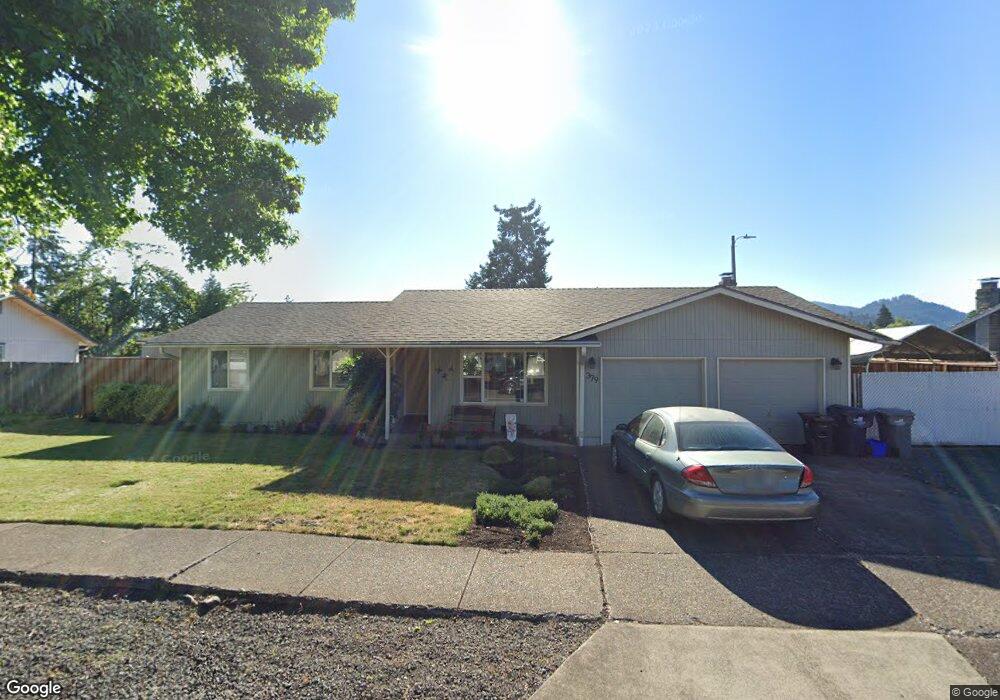
379 49th Loop Springfield, OR 97478
East Springfield NeighborhoodEstimated Value: $383,000 - $393,513
3
Beds
2
Baths
1,360
Sq Ft
$286/Sq Ft
Est. Value
About This Home
This home is located at 379 49th Loop, Springfield, OR 97478 and is currently estimated at $389,378, approximately $286 per square foot. 379 49th Loop is a home located in Lane County with nearby schools including Riverbend Elementary School, Agnes Stewart Middle School, and Thurston High School.
Ownership History
Date
Name
Owned For
Owner Type
Purchase Details
Closed on
Sep 29, 2025
Sold by
Bess Michael L
Bought by
Bess Sheila F
Current Estimated Value
Purchase Details
Closed on
Mar 9, 2005
Sold by
Bess Sheila F
Bought by
Bess Sheila F and Bess Michael L
Purchase Details
Closed on
Nov 8, 2001
Sold by
Hud
Bought by
Bess Sheila F
Purchase Details
Closed on
Sep 10, 2001
Sold by
First Horizon Home Loans
Bought by
Hud
Purchase Details
Closed on
Aug 17, 2001
Sold by
Viquelia Kriss N and Viquelia Tricia R
Bought by
First Horizon Home Loans
Purchase Details
Closed on
Nov 20, 1998
Sold by
Mcelhinny Cynthia L and Craig Cynthia L
Bought by
Viquelia Kriss N and Viquelia Tricia R
Home Financials for this Owner
Home Financials are based on the most recent Mortgage that was taken out on this home.
Original Mortgage
$117,301
Interest Rate
6.84%
Mortgage Type
FHA
Create a Home Valuation Report for This Property
The Home Valuation Report is an in-depth analysis detailing your home's value as well as a comparison with similar homes in the area
Home Values in the Area
Average Home Value in this Area
Purchase History
| Date | Buyer | Sale Price | Title Company |
|---|---|---|---|
| Bess Sheila F | -- | None Listed On Document | |
| Bess Sheila F | -- | American Title Group | |
| Bess Sheila F | $116,000 | Western Pioneer Title Co | |
| Hud | $114,929 | -- | |
| First Horizon Home Loans | $125,243 | Western Pioneer Title Co | |
| Viquelia Kriss N | $118,000 | Fidelity National Title Ins |
Source: Public Records
Mortgage History
| Date | Status | Borrower | Loan Amount |
|---|---|---|---|
| Previous Owner | Viquelia Kriss N | $117,301 |
Source: Public Records
Tax History
| Year | Tax Paid | Tax Assessment Tax Assessment Total Assessment is a certain percentage of the fair market value that is determined by local assessors to be the total taxable value of land and additions on the property. | Land | Improvement |
|---|---|---|---|---|
| 2025 | $3,647 | $198,889 | -- | -- |
| 2024 | $3,588 | $193,097 | -- | -- |
| 2023 | $3,588 | $187,473 | $0 | $0 |
| 2022 | $3,323 | $182,013 | $0 | $0 |
| 2021 | $3,264 | $176,712 | $0 | $0 |
| 2020 | $3,168 | $171,566 | $0 | $0 |
| 2019 | $3,073 | $166,569 | $0 | $0 |
| 2018 | $2,897 | $157,008 | $0 | $0 |
| 2017 | $2,785 | $157,008 | $0 | $0 |
| 2016 | $2,727 | $152,435 | $0 | $0 |
| 2015 | $2,649 | $147,995 | $0 | $0 |
| 2014 | $2,609 | $143,684 | $0 | $0 |
Source: Public Records
Map
Nearby Homes
- 0 N St
- 422 S 49th Place
- 503 S 51st Place
- 340 54th St
- 4973 Forsythia St
- 569 S 51st Place
- 5495 A Units 69 70 71 72 St
- 4733 Union Terrace
- 5210 Holly St
- 5259 Holly St
- 5024 Cedar View Dr
- 4908 Holly St
- 733 54th St
- 775 54th St
- 205 S 54th (#11) St Unit 11
- 4680 Glacier Meadows Loop
- 5335 Main St Unit 236
- 5335 Main St
- 5335 Main St Unit 184
- 5335 Main St Unit 197
Your Personal Tour Guide
Ask me questions while you tour the home.