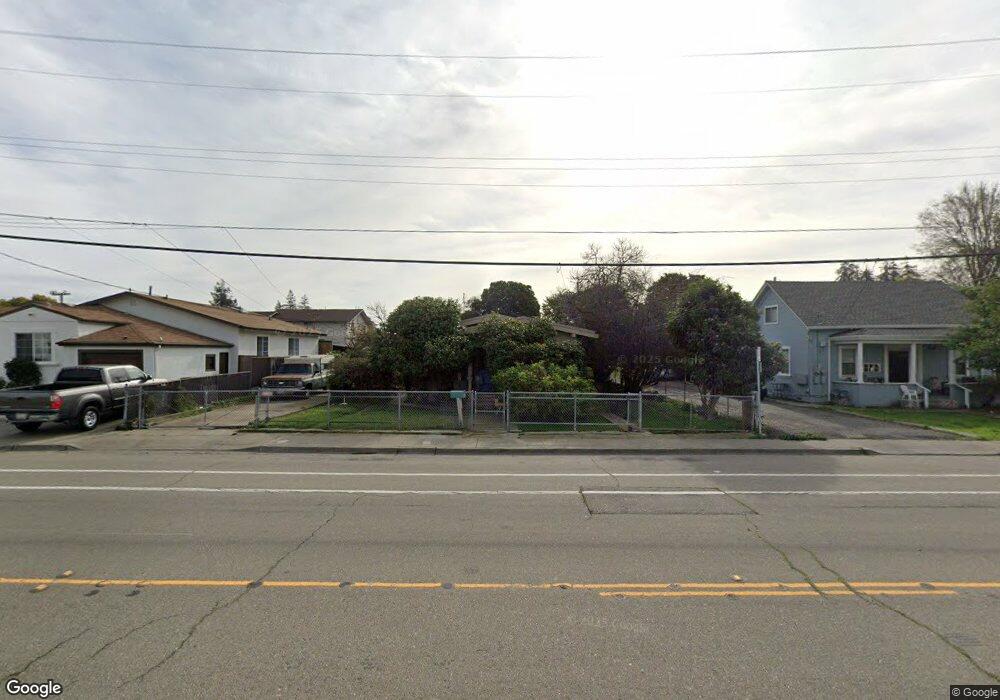
379 C St Hayward, CA 94541
Burbank NeighborhoodEstimated Value: $634,000 - $953,000
4
Beds
3
Baths
2,242
Sq Ft
$354/Sq Ft
Est. Value
About This Home
This home is located at 379 C St, Hayward, CA 94541 and is currently estimated at $793,500, approximately $353 per square foot. 379 C St is a home located in Alameda County with nearby schools including Burbank Elementary School, Winton Middle School, and Hayward High School.
Ownership History
Date
Name
Owned For
Owner Type
Purchase Details
Closed on
Mar 2, 2017
Sold by
Gallardo Wayne M
Bought by
Gallardo Wayne M and Wayne M Gallardo Trust
Current Estimated Value
Purchase Details
Closed on
Sep 12, 2016
Sold by
Manhoso Manuel and Manhoso Kathleen
Bought by
Manhoso Manuel and Manhoso Kathleen
Purchase Details
Closed on
Dec 23, 2003
Sold by
Gallardo Wilbert M and Gallardo Dorothy A
Bought by
Gallardo Wilbert M and Gallardo Dorothy A
Create a Home Valuation Report for This Property
The Home Valuation Report is an in-depth analysis detailing your home's value as well as a comparison with similar homes in the area
Home Values in the Area
Average Home Value in this Area
Purchase History
| Date | Buyer | Sale Price | Title Company |
|---|---|---|---|
| Gallardo Wayne M | -- | None Available | |
| Manhoso Kathleen E | -- | None Available | |
| Manhoso Manuel | -- | None Available | |
| Gallardo Wilbert M | -- | -- | |
| Galardo Wilbert M | -- | -- | |
| Gallardo Wilbert M | -- | -- |
Source: Public Records
Tax History
| Year | Tax Paid | Tax Assessment Tax Assessment Total Assessment is a certain percentage of the fair market value that is determined by local assessors to be the total taxable value of land and additions on the property. | Land | Improvement |
|---|---|---|---|---|
| 2025 | $1,577 | $92,846 | $45,245 | $47,601 |
| 2024 | $1,577 | $91,026 | $44,358 | $46,668 |
| 2023 | $1,556 | $89,241 | $43,488 | $45,753 |
| 2022 | $1,530 | $87,491 | $42,635 | $44,856 |
| 2021 | $1,516 | $85,775 | $41,799 | $43,976 |
| 2020 | $1,503 | $84,896 | $41,371 | $43,525 |
| 2019 | $1,510 | $83,232 | $40,560 | $42,672 |
| 2018 | $6,169 | $81,601 | $39,765 | $41,836 |
| 2017 | $1,417 | $80,000 | $38,985 | $41,015 |
| 2016 | $1,324 | $78,432 | $38,221 | $40,211 |
| 2015 | $1,305 | $77,254 | $37,647 | $39,607 |
| 2014 | $1,257 | $75,740 | $36,909 | $38,831 |
Source: Public Records
Map
Nearby Homes
- 522 B St
- 204 Sullivan Way
- 589 Staley Ave
- 22964 Alice St
- 568 Dean St
- 537 Dean St
- 622 Moss Way
- 22575 Amador St
- 257 Poplar Ave
- 710 City Walk Place Unit 3
- 710 City Walk Place Unit 4
- 728 City Walk Place Unit 4
- 22876 Charing St
- 742 B St
- 22716 Atherton St Unit 30
- 22894 Kingsford Way
- 22168 Peralta St
- 22133 Peralta St
- 24023 Edloe Dr
- 19895 Mission Blvd
Your Personal Tour Guide
Ask me questions while you tour the home.