379 C St Hayward, CA 94541
Burbank NeighborhoodEstimated Value: $758,000 - $822,000
About This Home
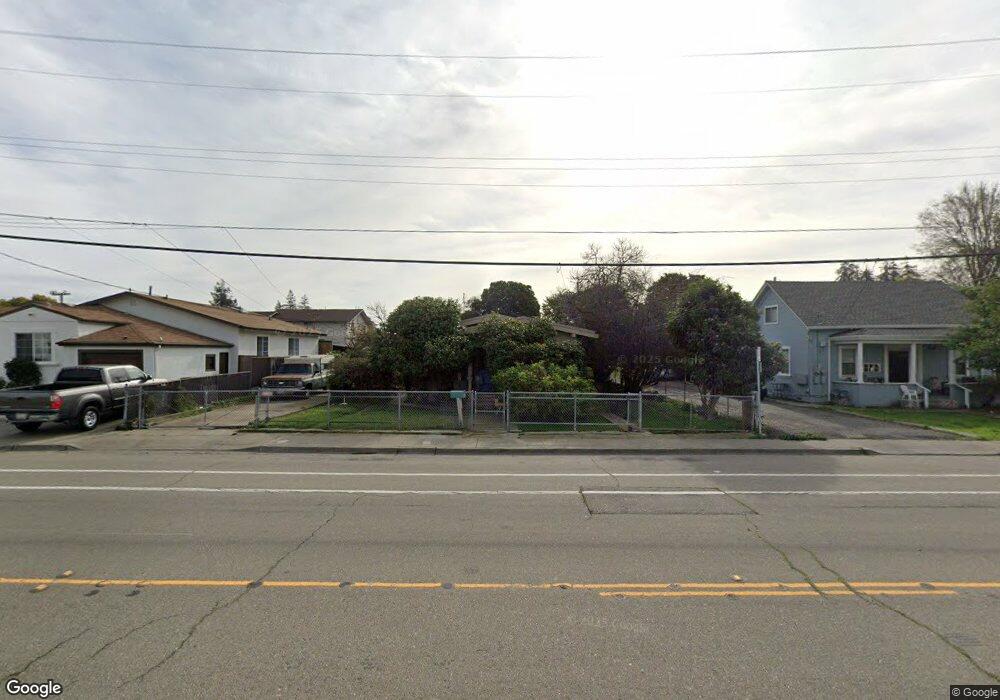
This home is located at 379 C St, Hayward, CA 94541 and is currently estimated at $790,000, approximately $352 per square foot. 379 C St is a home located in Alameda County with nearby schools including Burbank Elementary School, Winton Middle School, and Hayward High School.
Ownership History
We collect this data history from publicly available records. To have your information removed, we recommend requesting removal directly through your county’s website.
Purchase Details
Purchase Details
Purchase Details
Home Values in the Area
Average Home Value in this Area
Purchase History
We collect this data history from publicly available records. To have your information removed, we recommend requesting removal directly through your county’s website.
| Date | Buyer | Sale Price | Title Company |
|---|---|---|---|
| -- | None Available | ||
| -- | None Available | ||
| -- | None Available | ||
| -- | -- | ||
| -- | -- | ||
| -- | -- |
Tax History
We collect this data history from publicly available records. To have your information removed, we recommend requesting removal directly through your county’s website.
| Year | Tax Paid | Tax Assessment Tax Assessment Total Assessment is a certain percentage of the fair market value that is determined by local assessors to be the total taxable value of land and additions on the property. | Land | Improvement |
|---|---|---|---|---|
| 2025 | $1,577 | $92,846 | $45,245 | $47,601 |
| 2024 | $1,577 | $91,026 | $44,358 | $46,668 |
| 2023 | $1,556 | $89,241 | $43,488 | $45,753 |
| 2022 | $1,530 | $87,491 | $42,635 | $44,856 |
| 2021 | $1,516 | $85,775 | $41,799 | $43,976 |
| 2020 | $1,503 | $84,896 | $41,371 | $43,525 |
| 2019 | $1,510 | $83,232 | $40,560 | $42,672 |
| 2018 | $6,169 | $81,601 | $39,765 | $41,836 |
| 2017 | $1,417 | $80,000 | $38,985 | $41,015 |
| 2016 | $1,324 | $78,432 | $38,221 | $40,211 |
| 2015 | $1,305 | $77,254 | $37,647 | $39,607 |
| 2014 | $1,257 | $75,740 | $36,909 | $38,831 |
Map
- 516 Palmer Ave
- 22842 Myrtle St
- 4028 Freestone Place
- 403 Smalley Ave
- 246 Sullivan Way
- 3091 Madsen St
- 1012 Martin Luther King Dr
- 3087 Madsen St
- 542 A St
- 550 A St
- 900 Old Oak Ln Unit 3
- 568 Dean St
- 2305 Gibbons St
- 22354 Western Blvd
- 555 Laurel Ave
- 2334 Morrow St
- 1147 Martin Luther King Dr
- 655 Veranda Cir
- 257 Poplar Ave
- 728 City Walk Place Unit 4
Ask me questions while you tour the home.