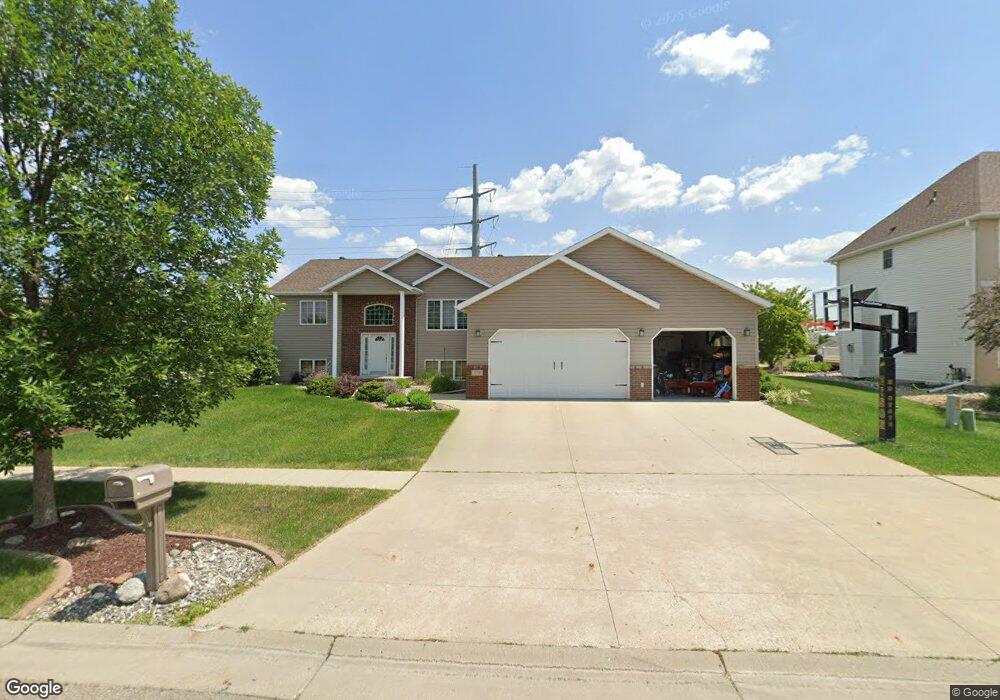
379 Edgewater Dr West Fargo, ND 58078
Charleswood NeighborhoodEstimated Value: $483,000 - $547,000
6
Beds
3
Baths
3,360
Sq Ft
$155/Sq Ft
Est. Value
About This Home
This home is located at 379 Edgewater Dr, West Fargo, ND 58078 and is currently estimated at $521,853, approximately $155 per square foot. 379 Edgewater Dr is a home located in Cass County with nearby schools including South Elementary School, Cheney Middle School, and West Fargo High School.
Ownership History
Date
Name
Owned For
Owner Type
Purchase Details
Closed on
Jul 29, 2015
Sold by
Brookfield Relocation Inc
Bought by
Jorgensen Kathryn and Jorgensen Ryan
Current Estimated Value
Home Financials for this Owner
Home Financials are based on the most recent Mortgage that was taken out on this home.
Original Mortgage
$274,400
Outstanding Balance
$215,741
Interest Rate
4.02%
Mortgage Type
New Conventional
Estimated Equity
$306,112
Purchase Details
Closed on
May 24, 2013
Sold by
Morris Richard R and Morris Danielle C
Bought by
Mcallister James H and Mcallister Laura M
Home Financials for this Owner
Home Financials are based on the most recent Mortgage that was taken out on this home.
Original Mortgage
$220,000
Interest Rate
3.38%
Mortgage Type
New Conventional
Create a Home Valuation Report for This Property
The Home Valuation Report is an in-depth analysis detailing your home's value as well as a comparison with similar homes in the area
Home Values in the Area
Average Home Value in this Area
Purchase History
| Date | Buyer | Sale Price | Title Company |
|---|---|---|---|
| Jorgensen Kathryn | $343,000 | None Available | |
| Brookfield Relocation Inc | $343,000 | Title Co | |
| Mcallister James H | $295,000 | Title Co |
Source: Public Records
Mortgage History
| Date | Status | Borrower | Loan Amount |
|---|---|---|---|
| Open | Jorgensen Kathryn | $274,400 | |
| Previous Owner | Mcallister James H | $220,000 |
Source: Public Records
Tax History Compared to Growth
Tax History
| Year | Tax Paid | Tax Assessment Tax Assessment Total Assessment is a certain percentage of the fair market value that is determined by local assessors to be the total taxable value of land and additions on the property. | Land | Improvement |
|---|---|---|---|---|
| 2024 | $6,060 | $232,750 | $45,500 | $187,250 |
| 2023 | $6,239 | $219,200 | $45,500 | $173,700 |
| 2022 | $6,342 | $213,450 | $45,500 | $167,950 |
| 2021 | $5,888 | $190,150 | $37,450 | $152,700 |
| 2020 | $5,648 | $186,550 | $37,450 | $149,100 |
| 2019 | $5,386 | $183,650 | $37,450 | $146,200 |
| 2018 | $5,125 | $182,250 | $37,450 | $144,800 |
| 2017 | $4,987 | $182,250 | $37,450 | $144,800 |
| 2016 | $5,825 | $178,700 | $37,450 | $141,250 |
| 2015 | $5,018 | $130,800 | $21,800 | $109,000 |
| 2014 | $4,876 | $122,250 | $21,800 | $100,450 |
| 2013 | $4,865 | $117,450 | $21,800 | $95,650 |
Source: Public Records
Map
Nearby Homes
- 373 Edgewater Dr
- 362 15th Ave E
- 367 Edgewater Dr
- 354 15th Ave E
- 378 Edgewater Dr
- 372 Edgewater Dr
- 346 15th Ave E
- 366 Edgewater Dr
- 361 Edgewater Dr
- 338 15th Ave E
- 333 15th Ave E
- 360 Edgewater Dr
- 355 Edgewater Dr
- 1439 Sterling Ct
- 330 15th Ave E
- 1433 Sterling Ct
- 326 St Charles Place
- 1427 Sterling Ct
- 325 15th Ave E
- 354 Edgewater Dr