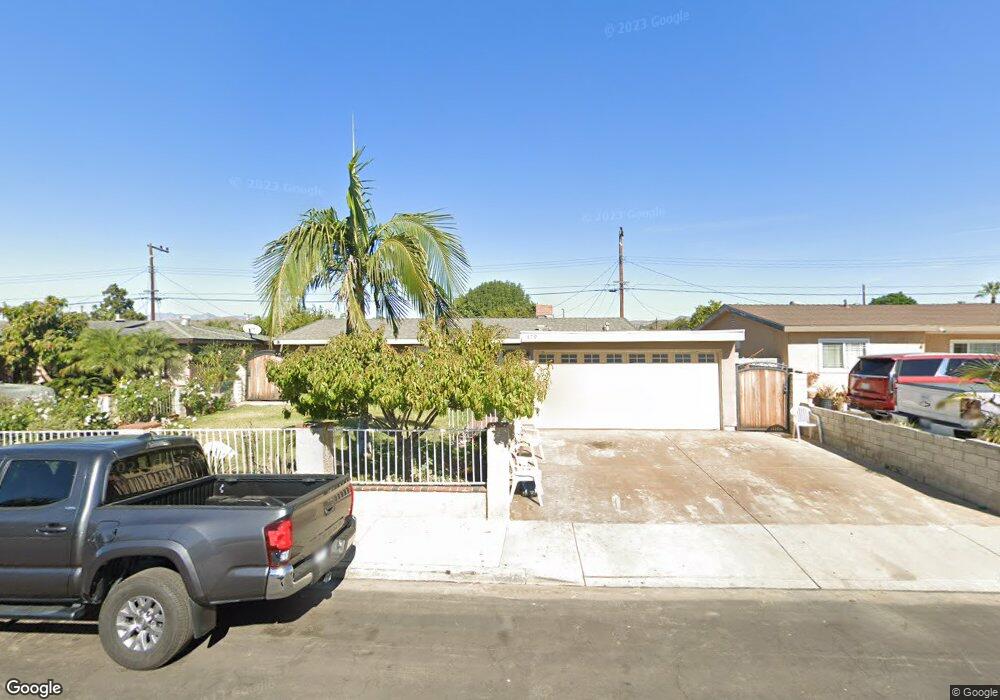
379 Esther Ave Moorpark, CA 93021
Estimated Value: $524,000 - $697,364
3
Beds
2
Baths
1,138
Sq Ft
$551/Sq Ft
Est. Value
About This Home
This home is located at 379 Esther Ave, Moorpark, CA 93021 and is currently estimated at $627,091, approximately $551 per square foot. 379 Esther Ave is a home located in Ventura County with nearby schools including Peach Hill Academy, Mesa Verde Middle School, and Moorpark High School.
Ownership History
Date
Name
Owned For
Owner Type
Purchase Details
Closed on
Jan 18, 2011
Sold by
Morales Juan C and Rios Ana L
Bought by
Morales Jose M and Vaca Ana J
Current Estimated Value
Purchase Details
Closed on
May 12, 2009
Sold by
Lopez Alfredo and Lopez Marisa
Bought by
Morales Jose M and Vaca Ana J
Home Financials for this Owner
Home Financials are based on the most recent Mortgage that was taken out on this home.
Original Mortgage
$260,200
Outstanding Balance
$164,135
Interest Rate
4.82%
Mortgage Type
FHA
Estimated Equity
$462,956
Purchase Details
Closed on
Jun 29, 2004
Sold by
Lopez Alfredo and Lopez Marisa
Bought by
Lopez Alfredo and Lopez Marisa
Purchase Details
Closed on
Jun 15, 1994
Sold by
Federal Home Loan Mortgage Corporation
Bought by
Lopez Alfredo and Lopez Marisa
Home Financials for this Owner
Home Financials are based on the most recent Mortgage that was taken out on this home.
Original Mortgage
$129,000
Interest Rate
8.51%
Create a Home Valuation Report for This Property
The Home Valuation Report is an in-depth analysis detailing your home's value as well as a comparison with similar homes in the area
Home Values in the Area
Average Home Value in this Area
Purchase History
| Date | Buyer | Sale Price | Title Company |
|---|---|---|---|
| Morales Jose M | -- | None Available | |
| Morales Jose M | $265,000 | Chicago Title Company | |
| Lopez Alfredo | -- | Ticor Title Co Glendale | |
| Lopez Alfredo | $133,000 | Fidelity National Title |
Source: Public Records
Mortgage History
| Date | Status | Borrower | Loan Amount |
|---|---|---|---|
| Open | Morales Jose M | $260,200 | |
| Previous Owner | Lopez Alfredo | $129,000 |
Source: Public Records
Tax History Compared to Growth
Tax History
| Year | Tax Paid | Tax Assessment Tax Assessment Total Assessment is a certain percentage of the fair market value that is determined by local assessors to be the total taxable value of land and additions on the property. | Land | Improvement |
|---|---|---|---|---|
| 2025 | $3,654 | $342,560 | $170,620 | $171,940 |
| 2024 | $3,654 | $335,844 | $167,275 | $168,569 |
| 2023 | $3,572 | $329,259 | $163,995 | $165,264 |
| 2022 | $3,479 | $322,803 | $160,779 | $162,024 |
| 2021 | $3,470 | $316,474 | $157,626 | $158,848 |
| 2020 | $3,436 | $313,230 | $156,010 | $157,220 |
| 2019 | $3,359 | $307,089 | $152,951 | $154,138 |
| 2018 | $3,323 | $301,068 | $149,952 | $151,116 |
| 2017 | $3,252 | $295,165 | $147,012 | $148,153 |
| 2016 | $3,190 | $289,379 | $144,130 | $145,249 |
| 2015 | $3,145 | $285,034 | $141,966 | $143,068 |
| 2014 | $3,048 | $278,372 | $139,186 | $139,186 |
Source: Public Records
Map
Nearby Homes
- 31 Fremont Ave
- 540 Spring Rd Unit 94
- 540 Spring Rd Unit 93
- 13191 Westcott Ct
- 445 Millard St
- 150 Majestic Ct Unit 1102
- 4540 Mill Valley Rd
- 4566 N Canyonlands Rd
- 4529 N Canyonlands Rd
- 4543 Silverbell Cir
- 13191 Honeybee St
- 13729 Bear Valley Rd
- 4175 Shady Point Dr
- 13749 Gunsmoke Rd
- 1363 Walnut Canyon Rd
- 4204 Laurel Glen Dr
- 4833 E Beltramo Ranch Rd
- 12490 Spring Creek Rd
- 393 Esther Ave
- 367 Esther Ave
- 380 Roberts Ave
- 394 Roberts Ave
- 368 Roberts Ave
- 411 Esther Ave
- 355 Esther Ave
- 380 Esther Ave
- 356 Roberts Ave
- 412 Roberts Ave
- 394 Esther Ave
- 368 Esther Ave
- 437 Esther Ave
- 343 Esther Ave
- 412 Esther Ave
- 356 Esther Ave
- 344 Roberts Ave
- 438 Roberts Ave
- 438 Esther Ave
- 344 Esther Ave