
Seller's Agent in 2021
Jody Landry
Keller Williams Gateway Realty
(603) 494-0090
9 in this area
188 Total Sales
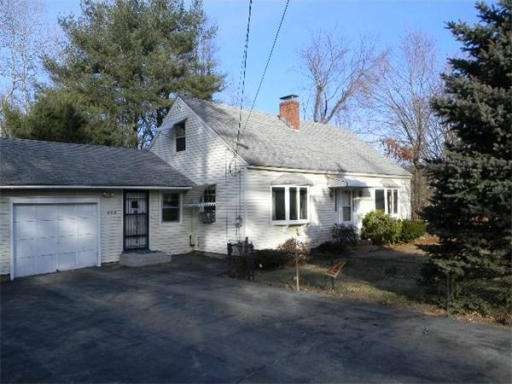
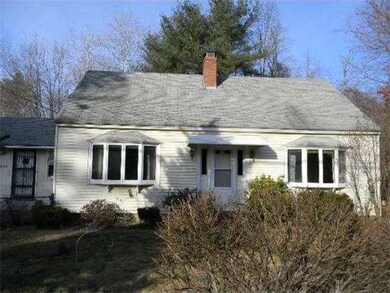
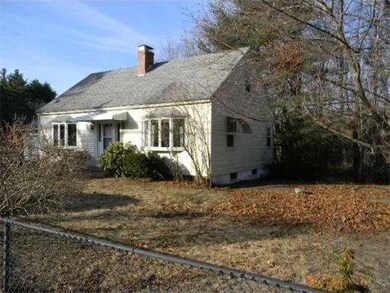
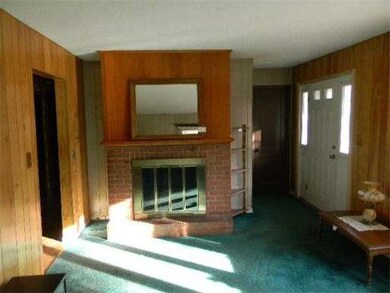
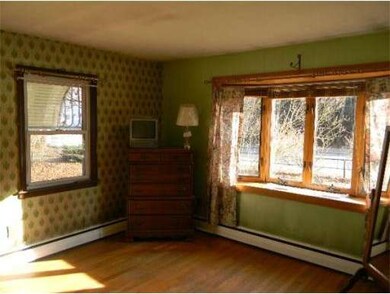
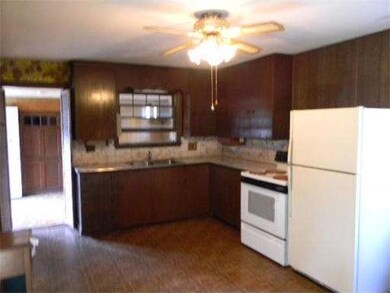
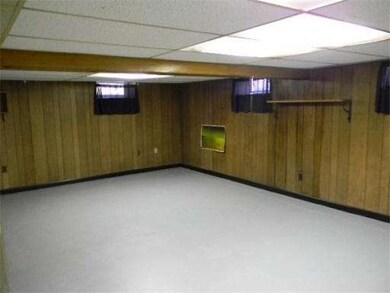
Priced to sell.Not a short sale or Bank owned. Quick close! Lots of sun comes in the windows in this well lived in Cape. 7 rooms 4 bedrooms 1bath 2 bedrooms are down on the first floor 2 up. Large eat in kitchen off the breeze way. Great playroom in the basement for the kids. One car garage is attached to the home. Lot is flat and partially fenced in front yard Enjoy the azealea's and rhodedenduns this spring!. Dont let this one by check it out today!
Last Agent to Sell the Property
Better Homes and Gardens Real Estate - The Masiello Group Listed on: 02/10/2012
Home Type
Single Family
Est. Annual Taxes
$6,862
Year Built
1957
Lot Details
0
| Date | Type | Sale Price | Title Company |
|---|---|---|---|
| Warranty Deed | $385,000 | None Available | |
| Warranty Deed | $385,000 | None Available | |
| Warranty Deed | $240,000 | -- | |
| Warranty Deed | $240,000 | -- | |
| Warranty Deed | $218,000 | -- | |
| Warranty Deed | $218,000 | -- | |
| Warranty Deed | $132,000 | -- | |
| Warranty Deed | $132,000 | -- |
| Date | Status | Loan Amount | Loan Type |
|---|---|---|---|
| Open | $378,026 | FHA | |
| Closed | $378,026 | FHA | |
| Closed | $7,430 | Stand Alone Second | |
| Previous Owner | $221,000 | Stand Alone Refi Refinance Of Original Loan | |
| Previous Owner | $217,000 | Stand Alone Refi Refinance Of Original Loan | |
| Previous Owner | $192,000 | New Conventional |
| Date | Event | Price | Change | Sq Ft Price |
|---|---|---|---|---|
| 08/30/2021 08/30/21 | Sold | $385,000 | 0.0% | $265 / Sq Ft |
| 08/30/2021 08/30/21 | Sold | $385,000 | -3.8% | $265 / Sq Ft |
| 07/30/2021 07/30/21 | Pending | -- | -- | -- |
| 07/21/2021 07/21/21 | Pending | -- | -- | -- |
| 07/21/2021 07/21/21 | Price Changed | $400,000 | 0.0% | $275 / Sq Ft |
| 07/20/2021 07/20/21 | Price Changed | $400,000 | -3.6% | $275 / Sq Ft |
| 07/12/2021 07/12/21 | Price Changed | $414,900 | 0.0% | $285 / Sq Ft |
| 07/12/2021 07/12/21 | Price Changed | $414,900 | -1.2% | $285 / Sq Ft |
| 07/09/2021 07/09/21 | Price Changed | $419,900 | 0.0% | $289 / Sq Ft |
| 06/30/2021 06/30/21 | For Sale | $419,900 | -2.3% | $289 / Sq Ft |
| 06/24/2021 06/24/21 | For Sale | $429,900 | +79.1% | $295 / Sq Ft |
| 08/26/2015 08/26/15 | Sold | $240,000 | +1.1% | $165 / Sq Ft |
| 07/23/2015 07/23/15 | Pending | -- | -- | -- |
| 07/20/2015 07/20/15 | For Sale | $237,500 | +8.9% | $163 / Sq Ft |
| 11/04/2012 11/04/12 | Sold | $218,000 | -12.4% | $86 / Sq Ft |
| 09/14/2012 09/14/12 | Pending | -- | -- | -- |
| 07/03/2012 07/03/12 | For Sale | $249,000 | +88.6% | $98 / Sq Ft |
| 03/13/2012 03/13/12 | Sold | $132,000 | -22.3% | $91 / Sq Ft |
| 02/28/2012 02/28/12 | Pending | -- | -- | -- |
| 02/22/2012 02/22/12 | Price Changed | $169,900 | -5.6% | $117 / Sq Ft |
| 02/10/2012 02/10/12 | For Sale | $180,000 | -- | $124 / Sq Ft |
| Year | Tax Paid | Tax Assessment Tax Assessment Total Assessment is a certain percentage of the fair market value that is determined by local assessors to be the total taxable value of land and additions on the property. | Land | Improvement |
|---|---|---|---|---|
| 2023 | $6,862 | $376,400 | $126,800 | $249,600 |
| 2022 | $6,802 | $376,400 | $126,800 | $249,600 |
| 2021 | $6,262 | $269,700 | $84,600 | $185,100 |
| 2020 | $6,098 | $269,700 | $84,600 | $185,100 |
| 2019 | $5,869 | $269,700 | $84,600 | $185,100 |
| 2018 | $5,720 | $269,700 | $84,600 | $185,100 |
| 2017 | $5,140 | $199,300 | $73,100 | $126,200 |
| 2016 | $4,996 | $199,300 | $73,100 | $126,200 |
| 2015 | $4,889 | $199,300 | $73,100 | $126,200 |
| 2014 | $4,793 | $199,300 | $73,100 | $126,200 |
Seller's Agent in 2021
Jody Landry
Keller Williams Gateway Realty
(603) 494-0090
9 in this area
188 Total Sales
Buyer's Agent in 2021
Chelsea Leveille
Keller Williams Realty Metropolitan
(603) 765-6749
5 in this area
161 Total Sales
Seller's Agent in 2015
Barry Warhola
Monument Realty
(603) 759-3849
6 in this area
166 Total Sales
Buyer's Agent in 2015
Susan Monette
Compass New England, LLC
(978) 857-7034
1 in this area
119 Total Sales
S
Seller's Agent in 2012
Sheila Cheney
Better Homes and Gardens Real Estate - The Masiello Group
(603) 508-0110
1 in this area
9 Total Sales
J
Seller's Agent in 2012
Julie Crema
Century 21 Cardinal
Source: MLS Property Information Network (MLS PIN)
MLS Number: 71337098
APN: NASH-000000-000000-000141C
Disclaimer: Certain information contained herein is derived from information provided by parties other than Homes.com. All information provided is deemed reliable, but is not guaranteed to be accurate and should be independently verified.
![]() The property listing data and information, or the Images, set forth herein were provided to MLS Property Information Network, Inc. from third party sources, including sellers, lessors and public records, and were compiled by MLS Property Information Network, Inc. The property listing data and information, and the Images, are for the personal, non-commercial use of consumers having a good faith interest in purchasing or leasing listed properties of the type displayed to them and may not be used for any purpose other than to identify prospective properties which such consumers may have a good faith interest in purchasing or leasing. MLS Property Information Network, Inc. and its subscribers disclaim any and all representations and warranties as to the accuracy of the property listing data and information, or as to the accuracy of any of the Images, set forth herein.
The property listing data and information, or the Images, set forth herein were provided to MLS Property Information Network, Inc. from third party sources, including sellers, lessors and public records, and were compiled by MLS Property Information Network, Inc. The property listing data and information, and the Images, are for the personal, non-commercial use of consumers having a good faith interest in purchasing or leasing listed properties of the type displayed to them and may not be used for any purpose other than to identify prospective properties which such consumers may have a good faith interest in purchasing or leasing. MLS Property Information Network, Inc. and its subscribers disclaim any and all representations and warranties as to the accuracy of the property listing data and information, or as to the accuracy of any of the Images, set forth herein.