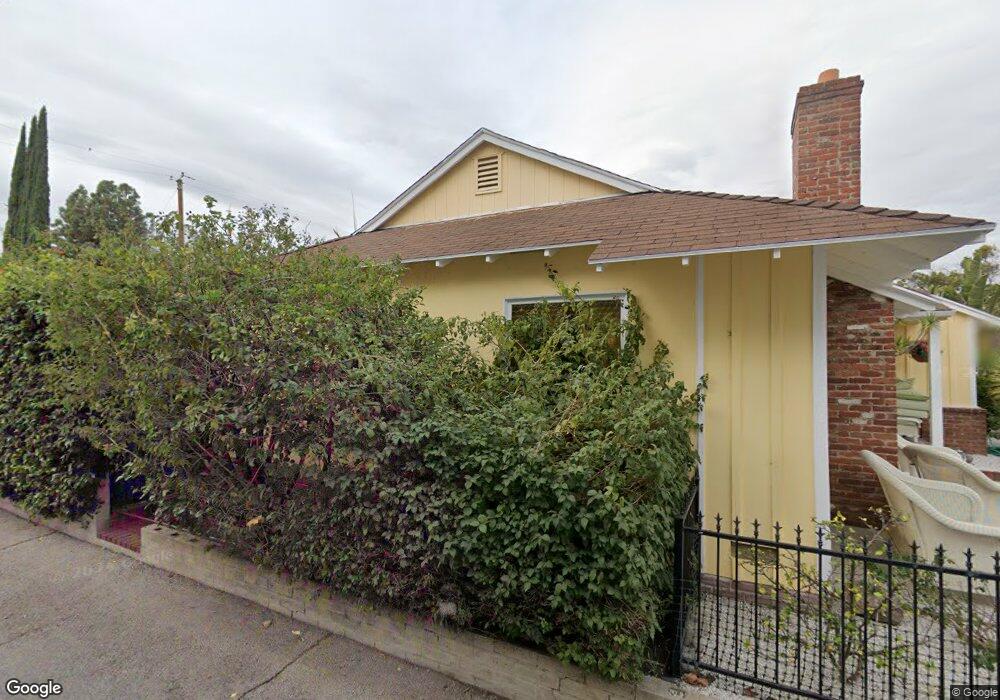
379 S Myers St Burbank, CA 91506
Rancho Adjacent NeighborhoodEstimated Value: $1,113,078 - $1,296,000
2
Beds
1
Bath
1,215
Sq Ft
$985/Sq Ft
Est. Value
About This Home
This home is located at 379 S Myers St, Burbank, CA 91506 and is currently estimated at $1,197,270, approximately $985 per square foot. 379 S Myers St is a home located in Los Angeles County with nearby schools including R. L. Stevenson Elementary School, Dolores Huerta Middle School, and John Burroughs High School.
Ownership History
Date
Name
Owned For
Owner Type
Purchase Details
Closed on
May 4, 2023
Sold by
Burckart Laura
Bought by
John And Laura Burckart Family Trust and Burckart
Current Estimated Value
Purchase Details
Closed on
Mar 26, 2004
Sold by
Burckart John F
Bought by
Burckart Laura
Home Financials for this Owner
Home Financials are based on the most recent Mortgage that was taken out on this home.
Original Mortgage
$205,000
Interest Rate
5.57%
Mortgage Type
New Conventional
Purchase Details
Closed on
Nov 20, 1996
Sold by
Ehlen Christine L and Ehlen Revocable Fa Christine L
Bought by
Burckart John F and Burckart Laura
Home Financials for this Owner
Home Financials are based on the most recent Mortgage that was taken out on this home.
Original Mortgage
$140,250
Interest Rate
7.53%
Create a Home Valuation Report for This Property
The Home Valuation Report is an in-depth analysis detailing your home's value as well as a comparison with similar homes in the area
Home Values in the Area
Average Home Value in this Area
Purchase History
| Date | Buyer | Sale Price | Title Company |
|---|---|---|---|
| John And Laura Burckart Family Trust | -- | None Listed On Document | |
| Burckart Laura | -- | Ticor Title Company | |
| Burckart John F | $165,000 | -- |
Source: Public Records
Mortgage History
| Date | Status | Borrower | Loan Amount |
|---|---|---|---|
| Previous Owner | Burckart Laura | $205,000 | |
| Previous Owner | Burckart John F | $140,250 |
Source: Public Records
Tax History Compared to Growth
Tax History
| Year | Tax Paid | Tax Assessment Tax Assessment Total Assessment is a certain percentage of the fair market value that is determined by local assessors to be the total taxable value of land and additions on the property. | Land | Improvement |
|---|---|---|---|---|
| 2025 | $3,803 | $333,856 | $195,429 | $138,427 |
| 2024 | $3,803 | $327,311 | $191,598 | $135,713 |
| 2023 | $3,764 | $320,894 | $187,842 | $133,052 |
| 2022 | $3,595 | $314,603 | $184,159 | $130,444 |
| 2021 | $3,577 | $308,436 | $180,549 | $127,887 |
| 2019 | $3,435 | $299,290 | $175,195 | $124,095 |
| 2018 | $3,363 | $293,422 | $171,760 | $121,662 |
| 2016 | $3,187 | $282,031 | $165,092 | $116,939 |
| 2015 | $3,123 | $277,796 | $162,613 | $115,183 |
| 2014 | $3,122 | $272,355 | $159,428 | $112,927 |
Source: Public Records
Map
Nearby Homes
- 314 S Myers St
- 238 S Lincoln St
- 527 S Orchard Dr
- 216 N Buena Vista St Unit 113
- 317 S Orchard Dr
- 211 N Frederic St
- 210 N Naomi St
- 315 N Catalina St
- 1520 W Riverside Dr
- 435 S Mariposa St
- 421 N Catalina St
- 150 N Ontario St
- 702 S Mariposa St
- 525 S Shelton St Unit 102
- 525 S Shelton St Unit 205
- 405 N Brighton St
- 3003 W Riverside Dr Unit 110
- 700 S Mariposa St
- 1324 W Morningside Dr
- 248 S Virginia Ave
- 371 S Myers St
- 363 S Myers St
- 338 S Lincoln St
- 334 S Lincoln St
- 355 S Myers St
- 330 S Lincoln St
- 378 S Myers St
- 370 S Myers St
- 326 S Lincoln St
- 347 S Myers St
- 362 S Myers St
- 322 S Lincoln St
- 354 S Myers St
- 339 S Myers St
- 346 S Myers St
- 331 S Myers St
- 338 S Myers St
- 341 S Keystone St
- 314 S Lincoln St
- 333 S Keystone St