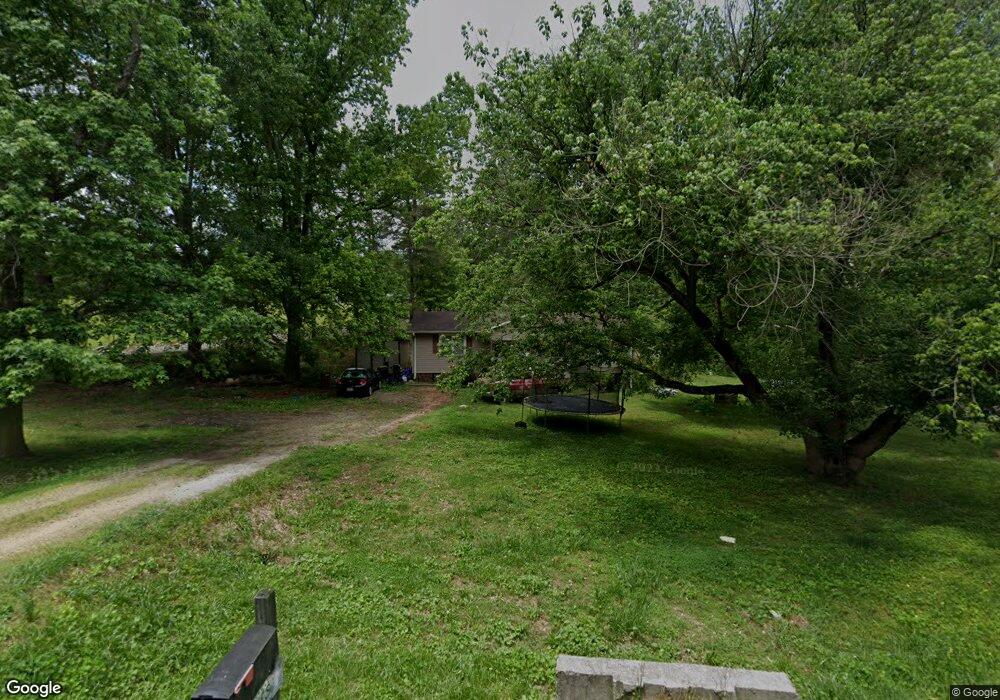
379 Turner Rd Eastanollee, GA 30538
Estimated Value: $207,169 - $263,000
3
Beds
2
Baths
1,152
Sq Ft
$210/Sq Ft
Est. Value
About This Home
This home is located at 379 Turner Rd, Eastanollee, GA 30538 and is currently estimated at $242,292, approximately $210 per square foot. 379 Turner Rd is a home located in Stephens County with nearby schools including Stephens County High School.
Ownership History
Date
Name
Owned For
Owner Type
Purchase Details
Closed on
Feb 17, 2025
Sold by
Jones Hubert R
Bought by
Jones Chris
Current Estimated Value
Create a Home Valuation Report for This Property
The Home Valuation Report is an in-depth analysis detailing your home's value as well as a comparison with similar homes in the area
Home Values in the Area
Average Home Value in this Area
Purchase History
| Date | Buyer | Sale Price | Title Company |
|---|---|---|---|
| Jones Chris | -- | -- |
Source: Public Records
Tax History Compared to Growth
Tax History
| Year | Tax Paid | Tax Assessment Tax Assessment Total Assessment is a certain percentage of the fair market value that is determined by local assessors to be the total taxable value of land and additions on the property. | Land | Improvement |
|---|---|---|---|---|
| 2024 | $1,188 | $39,029 | $5,486 | $33,543 |
| 2023 | $1,109 | $36,414 | $5,486 | $30,928 |
| 2022 | $1,011 | $33,961 | $5,009 | $28,952 |
| 2021 | $974 | $31,151 | $5,009 | $26,142 |
| 2020 | $992 | $31,413 | $5,009 | $26,404 |
| 2019 | $987 | $31,115 | $4,711 | $26,404 |
| 2018 | $923 | $31,115 | $4,711 | $26,404 |
| 2017 | $938 | $31,115 | $4,711 | $26,404 |
| 2016 | $923 | $31,114 | $4,711 | $26,403 |
| 2015 | $970 | $31,210 | $4,711 | $26,499 |
| 2014 | $1,030 | $32,511 | $4,711 | $27,800 |
| 2013 | -- | $32,511 | $4,711 | $27,800 |
Source: Public Records
Map
Nearby Homes
- 271 Oak Way Dr
- 160 Oak Way Dr
- 303 Oak Way Dr
- 232 Oak Way Dr
- 3953 Liberty Hill Rd
- 883 Dortch Rd
- 825 Dortch Rd
- 771 Dortch Rd
- 729 Dortch Rd
- 683 Dortch Rd
- 653 Dortch Rd
- 219 Eastanollee Rd
- 2657 Wolfpit Rd
- 290 Indian Dr
- 0 Eastanollee Rd Unit 10440265
- 218 Jefferson Place
- 33 Jefferson Place
- 160 Buena Vista Dr
- 770 Buena Vista Dr
- 123 Gennings Dr
- 343 Turner Rd
- 315 Turner Rd
- 483 Turner Rd
- 514 Turner Rd
- 255 Turner Rd
- 255 Turner Rd
- 306 Turner Rd
- 567 Turner Rd
- 0 Turner Rd Unit 3143564
- 0 Turner Rd Unit 7032122
- 0 Turner Rd Unit 7194101
- 0 Turner Rd Unit 7294755
- 0 Turner Rd Unit CM978522
- 0 Turner Rd Unit 20237559
- 0 Turner Rd Unit 20241020
- 0 Turner Rd Unit 20246469
- 0 Turner Rd Unit 935819
- 0 Turner Rd Unit 982464
- 0 Turner Rd Unit 7488435
- 0 Turner Rd Unit 9008821