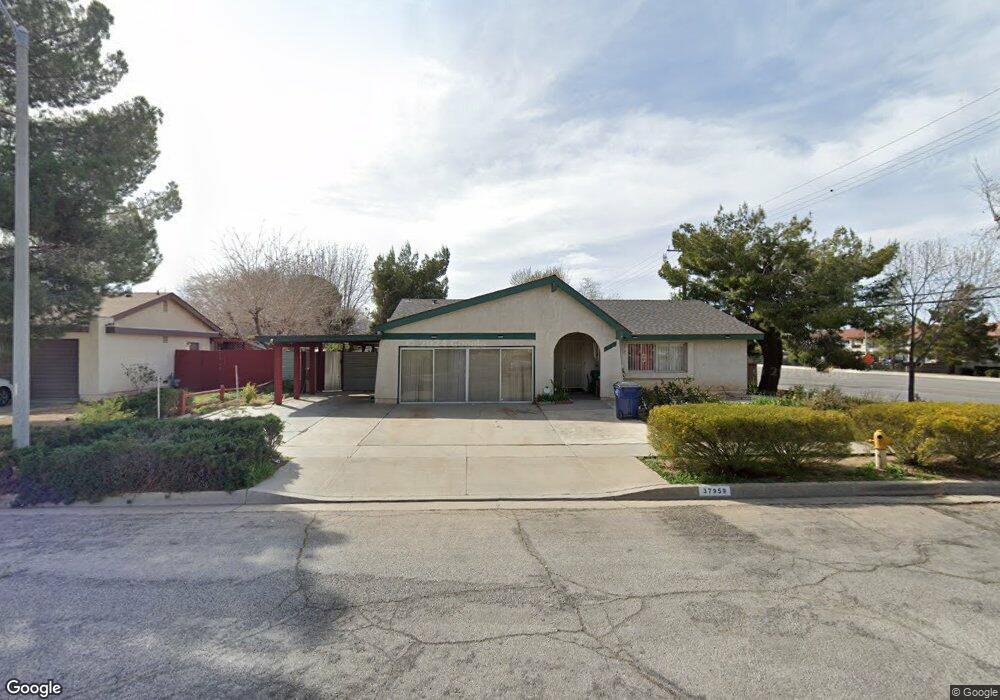
37959 28th St E Palmdale, CA 93550
East Palmdale NeighborhoodEstimated Value: $429,018 - $481,000
4
Beds
2
Baths
1,399
Sq Ft
$325/Sq Ft
Est. Value
About This Home
This home is located at 37959 28th St E, Palmdale, CA 93550 and is currently estimated at $454,005, approximately $324 per square foot. 37959 28th St E is a home located in Los Angeles County with nearby schools including Desert Rose Elementary School, Cactus Magnet Academy, and Palmdale High School.
Ownership History
Date
Name
Owned For
Owner Type
Purchase Details
Closed on
Apr 4, 2007
Sold by
Haoson Amalia F and Haoson Amalia Franco
Bought by
Haoson Tony R and Haoson Amalia F
Current Estimated Value
Home Financials for this Owner
Home Financials are based on the most recent Mortgage that was taken out on this home.
Original Mortgage
$170,000
Outstanding Balance
$102,673
Interest Rate
6.13%
Mortgage Type
New Conventional
Estimated Equity
$351,332
Purchase Details
Closed on
Jun 3, 2004
Sold by
Haoson Tony R and Haoson Amalia F
Bought by
Haoson Amalia Franco
Purchase Details
Closed on
Feb 23, 2002
Sold by
Henderson Beryl E and The Beryl E Henderson Revocabl
Bought by
Haoson Tony R and Haoson Amalia F
Home Financials for this Owner
Home Financials are based on the most recent Mortgage that was taken out on this home.
Original Mortgage
$123,892
Interest Rate
6.85%
Mortgage Type
FHA
Purchase Details
Closed on
Sep 30, 1993
Sold by
Henderson Beryl E
Bought by
Henderson Beryl E
Create a Home Valuation Report for This Property
The Home Valuation Report is an in-depth analysis detailing your home's value as well as a comparison with similar homes in the area
Home Values in the Area
Average Home Value in this Area
Purchase History
| Date | Buyer | Sale Price | Title Company |
|---|---|---|---|
| Haoson Tony R | -- | Ticor Title | |
| Haoson Amalia Franco | -- | -- | |
| Haoson Tony R | $125,000 | South Coast Title Company | |
| Henderson Beryl E | -- | -- |
Source: Public Records
Mortgage History
| Date | Status | Borrower | Loan Amount |
|---|---|---|---|
| Open | Haoson Tony R | $170,000 | |
| Closed | Haoson Tony R | $123,892 |
Source: Public Records
Tax History
| Year | Tax Paid | Tax Assessment Tax Assessment Total Assessment is a certain percentage of the fair market value that is determined by local assessors to be the total taxable value of land and additions on the property. | Land | Improvement |
|---|---|---|---|---|
| 2025 | $3,228 | $184,641 | $36,921 | $147,720 |
| 2024 | $3,228 | $181,022 | $36,198 | $144,824 |
| 2023 | $3,206 | $177,474 | $35,489 | $141,985 |
| 2022 | $3,089 | $173,995 | $34,794 | $139,201 |
| 2021 | $3,024 | $170,584 | $34,112 | $136,472 |
| 2019 | $2,940 | $165,526 | $33,101 | $132,425 |
| 2018 | $2,899 | $162,281 | $32,452 | $129,829 |
| 2016 | $2,713 | $155,982 | $31,193 | $124,789 |
| 2015 | $2,691 | $153,640 | $30,725 | $122,915 |
| 2014 | $2,377 | $126,000 | $25,200 | $100,800 |
Source: Public Records
Map
Nearby Homes
- 0 28th St E
- 37837 29th St E
- 2627 E Avenue q15
- 0 26th St E Unit SR25268352
- 0 27th Ste Vic Ave R10 Unit 26001399
- 0 27th Ste Vic Ave R10 Unit 26001398
- 38028 Jeri Ln
- 0 Avenue R4 30th St E Unit 24007965
- 0 E Vac 30th Ste Pav Vic Ave #R St
- 3063 Marbella Ln
- 3102 E Avenue q13
- 38202 Mendocino Way
- 3131 Maricotte Dr
- 37633 29th St E
- 3134 Maricotte Dr
- 3110 Viana Dr
- 26 Ste Vic Ave
- 3108 E Avenue r4
- 37923 Tamara Place
- 0 Palmdale Blvd Vic 27th E Unit 25005346
- 37953 28th St E
- 37945 28th St E
- 37952 28th St E
- 37946 28th St E
- 37939 28th St E
- 37938 28th St E
- 37945 29th St E
- 37931 28th St E
- 37939 29th St E
- 37932 28th St E
- 37931 29th St E
- 37925 28th St E
- 37924 28th St E
- 37925 29th St E
- 37952 29th St E
- 37917 28th St E
- 37917 29th St E
- 37916 28th St E
- 37938 29th St E
- 0 Vac Cor Avenue R8 28th Ste Unit DW18113436
Your Personal Tour Guide
Ask me questions while you tour the home.