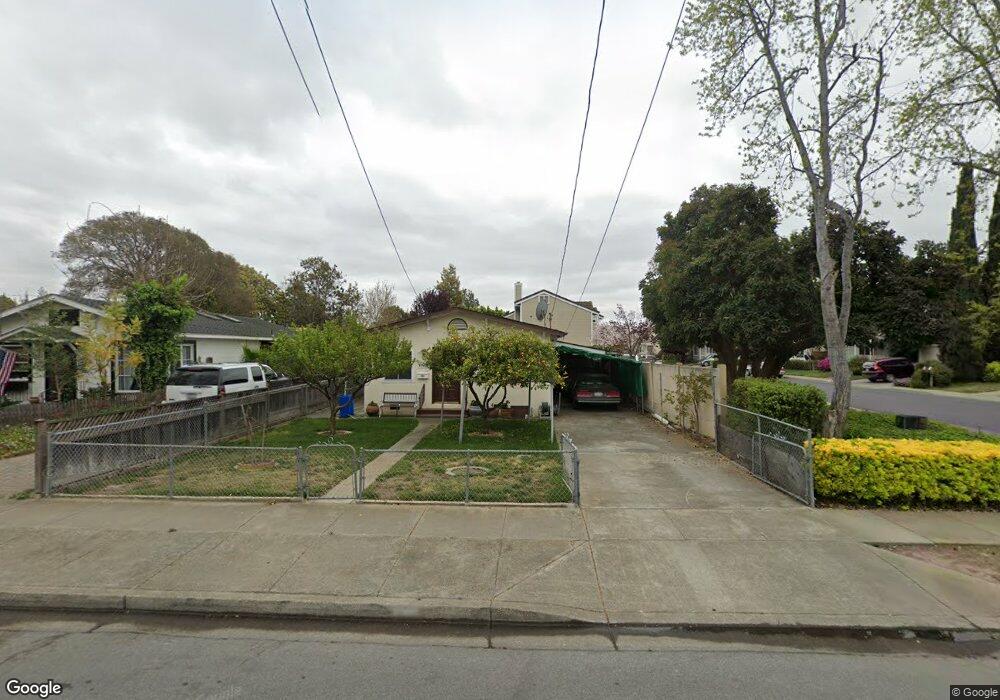
37965 3rd St Fremont, CA 94536
Niles NeighborhoodEstimated Value: $1,029,000 - $1,192,000
2
Beds
1
Bath
1,012
Sq Ft
$1,100/Sq Ft
Est. Value
About This Home
This home is located at 37965 3rd St, Fremont, CA 94536 and is currently estimated at $1,112,855, approximately $1,099 per square foot. 37965 3rd St is a home located in Alameda County with nearby schools including Niles Elementary School, Centerville Junior High School, and Washington High School.
Ownership History
Date
Name
Owned For
Owner Type
Purchase Details
Closed on
Feb 12, 2003
Sold by
Pimentel Joao C and Pimentel Maria P
Bought by
Pimentel Joao C and Pimentel Maria P
Current Estimated Value
Create a Home Valuation Report for This Property
The Home Valuation Report is an in-depth analysis detailing your home's value as well as a comparison with similar homes in the area
Home Values in the Area
Average Home Value in this Area
Purchase History
| Date | Buyer | Sale Price | Title Company |
|---|---|---|---|
| Pimentel Joao C | -- | -- |
Source: Public Records
Tax History Compared to Growth
Tax History
| Year | Tax Paid | Tax Assessment Tax Assessment Total Assessment is a certain percentage of the fair market value that is determined by local assessors to be the total taxable value of land and additions on the property. | Land | Improvement |
|---|---|---|---|---|
| 2025 | $1,260 | $39,472 | $23,046 | $16,426 |
| 2024 | $1,260 | $38,698 | $22,594 | $16,104 |
| 2023 | $1,206 | $37,940 | $22,151 | $15,789 |
| 2022 | $1,160 | $37,196 | $21,717 | $15,479 |
| 2021 | $1,140 | $36,467 | $21,291 | $15,176 |
| 2020 | $1,043 | $36,093 | $21,073 | $15,020 |
| 2019 | $1,037 | $35,386 | $20,660 | $14,726 |
| 2018 | $1,013 | $34,692 | $20,255 | $14,437 |
| 2017 | $989 | $34,012 | $19,858 | $14,154 |
| 2016 | $957 | $33,344 | $19,468 | $13,876 |
| 2015 | $930 | $32,844 | $19,176 | $13,668 |
| 2014 | $903 | $32,200 | $18,800 | $13,400 |
Source: Public Records
Map
Nearby Homes
- 38071 3rd St
- 37899 3rd St
- Residence T2 Plan at Hartford - Towns
- Residence T3 Plan at Hartford - Towns
- Residence T1 Plan at Hartford - Towns
- 38019 Cinematic Common
- 37847 Niles Blvd
- 337 I St
- 37915 Vallejo St
- 35796 Mission Blvd
- 38055 Cinematic Common
- 118 Sycamore St
- 37373 3rd St
- 37230 2nd St
- 38367 Oliver Way
- 38555 Overacker Ave
- 38521 Royal Ann Common
- 711 Old Canyon Rd Unit 77
- 711 Old Canyon Rd Unit 97
- 711 Old Canyon Rd Unit 169
- 37977 3rd St
- 368 De Salle Terrace
- 37985 3rd St
- 363 De Salle Terrace
- 37997 3rd St
- 374 De Salle Terrace
- 353 L St
- 369 De Salle Terrace
- 37929 3rd St
- 367 L St
- 37946 3rd St
- 375 De Salle Terrace
- 332 Riverside Ave
- 380 De Salle Terrace
- 37917 3rd St
- 37940 3rd St
- 37934 3rd St
- 340 Riverside Ave
- 381 L St
- 381 De Salle Terrace