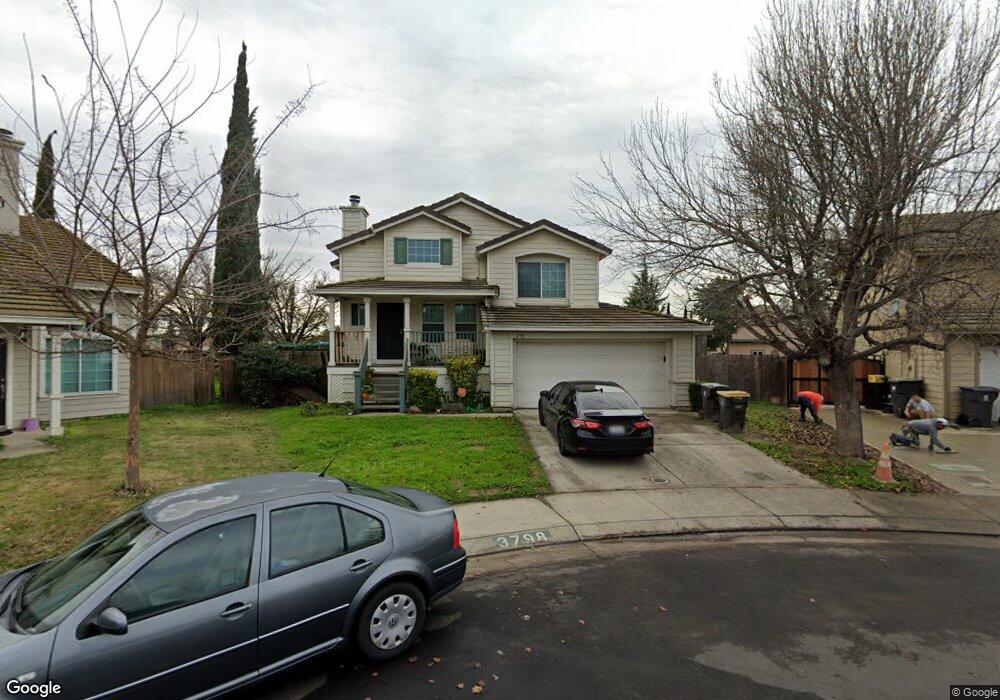
3798 Steve Lillie Cir Stockton, CA 95206
Weston Ranch NeighborhoodEstimated Value: $396,000 - $491,176
4
Beds
3
Baths
1,690
Sq Ft
$261/Sq Ft
Est. Value
About This Home
This home is located at 3798 Steve Lillie Cir, Stockton, CA 95206 and is currently estimated at $441,794, approximately $261 per square foot. 3798 Steve Lillie Cir is a home located in San Joaquin County with nearby schools including Great Valley Elementary School and Weston Ranch High School.
Ownership History
Date
Name
Owned For
Owner Type
Purchase Details
Closed on
Jul 19, 1999
Sold by
Hud
Bought by
Carganilla Freddie C
Current Estimated Value
Home Financials for this Owner
Home Financials are based on the most recent Mortgage that was taken out on this home.
Original Mortgage
$134,888
Outstanding Balance
$37,634
Interest Rate
7.51%
Estimated Equity
$404,160
Purchase Details
Closed on
Dec 28, 1998
Sold by
Rich Rafanan
Bought by
Fleet Mtg Corp and Fleet Real Estate Funding Corp
Purchase Details
Closed on
Aug 28, 1995
Sold by
Kaufman & Broad Central Valley Inc
Bought by
Rafanan Rich and Rafanan Camye
Home Financials for this Owner
Home Financials are based on the most recent Mortgage that was taken out on this home.
Original Mortgage
$128,272
Interest Rate
7.63%
Mortgage Type
Seller Take Back
Purchase Details
Closed on
May 18, 1994
Sold by
Union Bank
Bought by
Kaufman & Broad Central Valley Inc
Create a Home Valuation Report for This Property
The Home Valuation Report is an in-depth analysis detailing your home's value as well as a comparison with similar homes in the area
Home Values in the Area
Average Home Value in this Area
Purchase History
| Date | Buyer | Sale Price | Title Company |
|---|---|---|---|
| Carganilla Freddie C | $137,000 | Stewart Title | |
| Fleet Mtg Corp | $140,076 | Fidelity National Title Ins | |
| Rafanan Rich | $130,500 | First American | |
| Kaufman & Broad Central Valley Inc | $931,000 | Chicago Title Company |
Source: Public Records
Mortgage History
| Date | Status | Borrower | Loan Amount |
|---|---|---|---|
| Open | Carganilla Freddie C | $134,888 | |
| Previous Owner | Rafanan Rich | $128,272 |
Source: Public Records
Tax History Compared to Growth
Tax History
| Year | Tax Paid | Tax Assessment Tax Assessment Total Assessment is a certain percentage of the fair market value that is determined by local assessors to be the total taxable value of land and additions on the property. | Land | Improvement |
|---|---|---|---|---|
| 2025 | $3,199 | $210,551 | $38,419 | $172,132 |
| 2024 | $3,092 | $206,423 | $37,666 | $168,757 |
| 2023 | $2,982 | $202,377 | $36,928 | $165,449 |
| 2022 | $2,912 | $198,409 | $36,204 | $162,205 |
| 2021 | $2,853 | $194,520 | $35,495 | $159,025 |
| 2020 | $2,748 | $192,527 | $35,132 | $157,395 |
| 2019 | $2,702 | $188,753 | $34,444 | $154,309 |
| 2018 | $2,682 | $185,053 | $33,769 | $151,284 |
| 2017 | $2,634 | $181,425 | $33,107 | $148,318 |
| 2016 | $2,531 | $177,869 | $32,458 | $145,411 |
| 2014 | $2,557 | $171,765 | $31,344 | $140,421 |
Source: Public Records
Map
Nearby Homes
- 3812 Steve Lillie Cir
- 4144 Blake Cir
- 703 Villanueva Ct
- 4154 Kassady Ct
- 3707 French Camp
- 4309 Blake Cir
- 921 Kate Linde Cir
- 4303 Giselle Ln
- 627 Queensland Cir
- 971 Kate Linde Cir
- 1141 Klemeyer Cir
- 761 Sandstone Dr
- 1117 Glenmohr Ct
- 1131 Klemeyer Cir
- 624 Flagstone Dr
- 668 Flagstone Dr
- 1044 Henry Long Blvd
- 3677 Harvey Ave
- 3330 Konig Ct
- 3412 Shogoro Ln
- 3796 Steve Lillie Cir
- 627 William Moss Blvd
- 3802 Steve Lillie Cir
- 3804 Steve Lillie Cir
- 639 William Moss Blvd
- 3806 Steve Lillie Cir
- 3794 Steve Lillie Cir
- 3792 Steve Lillie Cir
- 3790 Steve Lillie Cir
- 651 William Moss Blvd
- 3808 Steve Lillie Cir
- 3801 Steve Lillie Cir
- 3789 Steve Lillie Cir
- 3788 Steve Lillie Cir
- 3803 Loto Ct
- 3786 Steve Lillie Cir
- 3810 Steve Lillie Cir
- 663 William Moss Blvd
- 3805 Loto Ct
- 3783 Steve Lillie Cir