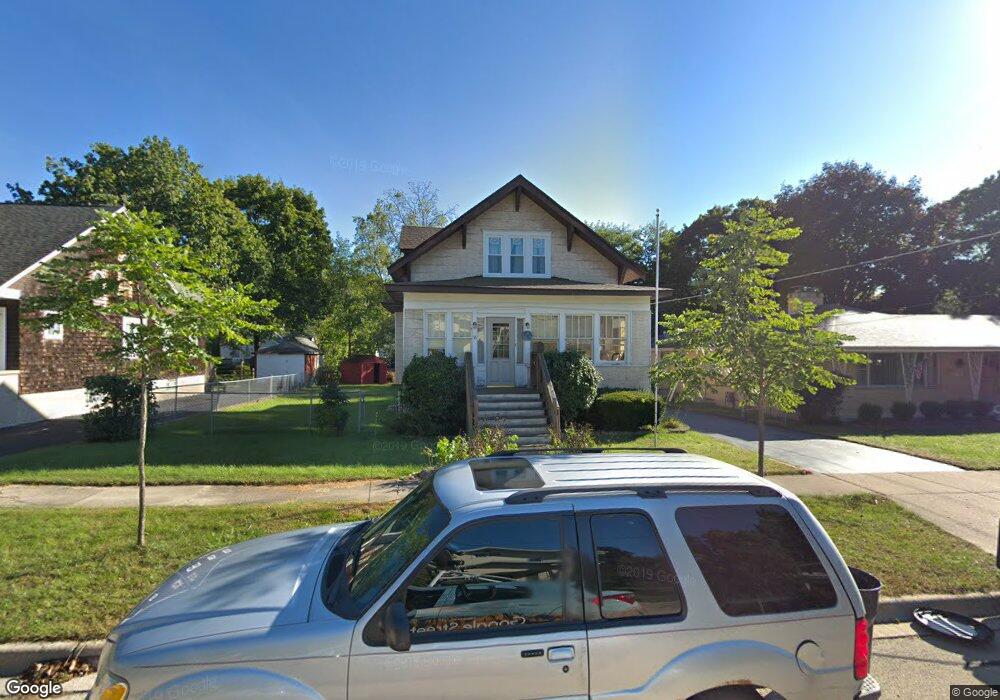
38 Center St Algonquin, IL 60102
Traube Fox River View NeighborhoodEstimated Value: $258,587 - $311,000
2
Beds
2
Baths
1,334
Sq Ft
$216/Sq Ft
Est. Value
About This Home
This home is located at 38 Center St, Algonquin, IL 60102 and is currently estimated at $287,647, approximately $215 per square foot. 38 Center St is a home located in McHenry County with nearby schools including Eastview Elementary School, Algonquin Middle School, and Dundee-Crown High School.
Ownership History
Date
Name
Owned For
Owner Type
Purchase Details
Closed on
Jul 27, 2001
Sold by
Merchut Carl and Merchut Diane
Bought by
Greer David and Greer Susan
Current Estimated Value
Home Financials for this Owner
Home Financials are based on the most recent Mortgage that was taken out on this home.
Original Mortgage
$147,875
Outstanding Balance
$58,225
Interest Rate
7.28%
Mortgage Type
FHA
Estimated Equity
$229,422
Purchase Details
Closed on
Aug 28, 1998
Sold by
Springate Carla S and Knudsen Carls S
Bought by
Merchut Carl and Merchut Diane J
Home Financials for this Owner
Home Financials are based on the most recent Mortgage that was taken out on this home.
Original Mortgage
$96,800
Interest Rate
7.04%
Purchase Details
Closed on
Mar 30, 1997
Sold by
Springate Daniel C
Bought by
Springate Carla S
Purchase Details
Closed on
Jan 19, 1994
Sold by
Hayden Dale Allen
Bought by
Springate Daniel C and Springate Carla S
Home Financials for this Owner
Home Financials are based on the most recent Mortgage that was taken out on this home.
Original Mortgage
$105,925
Interest Rate
7.26%
Create a Home Valuation Report for This Property
The Home Valuation Report is an in-depth analysis detailing your home's value as well as a comparison with similar homes in the area
Home Values in the Area
Average Home Value in this Area
Purchase History
| Date | Buyer | Sale Price | Title Company |
|---|---|---|---|
| Greer David | $150,000 | -- | |
| Merchut Carl | $121,000 | -- | |
| Springate Carla S | -- | -- | |
| Springate Daniel C | $111,500 | -- |
Source: Public Records
Mortgage History
| Date | Status | Borrower | Loan Amount |
|---|---|---|---|
| Open | Greer David | $147,875 | |
| Previous Owner | Merchut Carl | $96,800 | |
| Previous Owner | Springate Daniel C | $105,925 |
Source: Public Records
Tax History Compared to Growth
Tax History
| Year | Tax Paid | Tax Assessment Tax Assessment Total Assessment is a certain percentage of the fair market value that is determined by local assessors to be the total taxable value of land and additions on the property. | Land | Improvement |
|---|---|---|---|---|
| 2024 | $4,892 | $78,535 | $20,506 | $58,029 |
| 2023 | $4,541 | $70,240 | $18,340 | $51,900 |
| 2022 | $3,650 | $53,561 | $11,523 | $42,038 |
| 2021 | $3,452 | $49,898 | $10,735 | $39,163 |
| 2020 | $3,334 | $48,132 | $10,355 | $37,777 |
| 2019 | $3,220 | $46,068 | $9,911 | $36,157 |
| 2018 | $3,484 | $42,557 | $9,156 | $33,401 |
| 2017 | $3,395 | $40,092 | $8,626 | $31,466 |
| 2016 | $3,323 | $37,602 | $8,090 | $29,512 |
| 2013 | -- | $47,365 | $7,548 | $39,817 |
Source: Public Records
Map
Nearby Homes
- 102 Center St
- 314 Washington St
- 0 River Dr N Unit MRD12473279
- 600 E Algonquin Rd
- 721 Brentwood Ct
- 420 N Harrison St
- 2 Sunset Ln
- 1245 Winaki Trail
- 0 Natoma Trail
- 1188 E Algonquin Rd
- lot 25 Wabican Trail
- 911 Old Oak Cir Unit 1
- 710 Sprucetree Ln
- 903 Old Oak Cir
- 920 Plymouth Ct
- 1 N Hubbard St
- SWC Talaga and Algonquin Rd
- 925 N River Rd
- 1235 Fairmont Ct
- 1114 Riverwood Dr Unit 1114