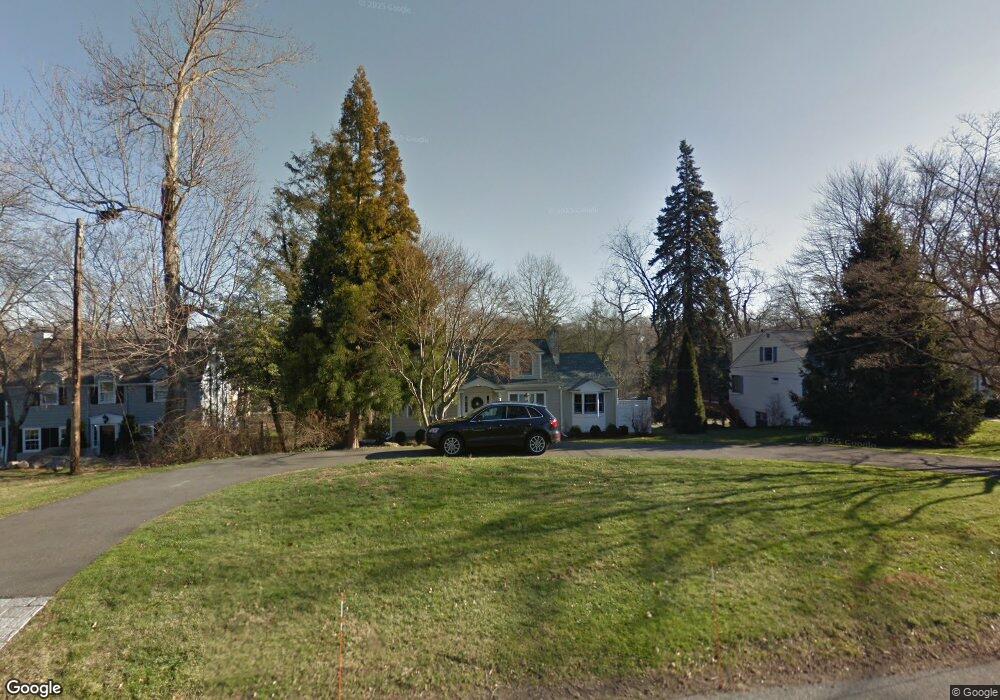
38 Crescent Rd Riverside, CT 06878
Estimated Value: $2,211,326 - $2,770,000
4
Beds
3
Baths
3,000
Sq Ft
$806/Sq Ft
Est. Value
About This Home
This home is located at 38 Crescent Rd, Riverside, CT 06878 and is currently estimated at $2,418,582, approximately $806 per square foot. 38 Crescent Rd is a home located in Fairfield County with nearby schools including Riverside School, Eastern Middle School, and Greenwich High School.
Ownership History
Date
Name
Owned For
Owner Type
Purchase Details
Closed on
Jun 27, 2012
Sold by
Ryckman Jonathan and Ryckman Paola
Bought by
Junnier Kelly and Valliere Phillip
Current Estimated Value
Home Financials for this Owner
Home Financials are based on the most recent Mortgage that was taken out on this home.
Original Mortgage
$975,000
Interest Rate
3.78%
Mortgage Type
Adjustable Rate Mortgage/ARM
Purchase Details
Closed on
Jul 9, 2004
Sold by
Abrams Linus S and Abrams Sharon
Bought by
Ryckman Jonathan and Narder Paola
Purchase Details
Closed on
Feb 9, 2000
Sold by
Speirs James A and Speirs Debra L
Bought by
Abrams Linus S
Purchase Details
Closed on
Aug 1, 1994
Sold by
Hillis Bruce C and Hillis Joyce
Bought by
Speirs James Allan and Speirs Debra L
Create a Home Valuation Report for This Property
The Home Valuation Report is an in-depth analysis detailing your home's value as well as a comparison with similar homes in the area
Home Values in the Area
Average Home Value in this Area
Purchase History
| Date | Buyer | Sale Price | Title Company |
|---|---|---|---|
| Junnier Kelly | $1,295,000 | -- | |
| Ryckman Jonathan | $1,280,000 | -- | |
| Abrams Linus S | $750,000 | -- | |
| Speirs James Allan | $470,000 | -- |
Source: Public Records
Mortgage History
| Date | Status | Borrower | Loan Amount |
|---|---|---|---|
| Open | Speirs James Allan | $975,000 | |
| Closed | Speirs James Allan | $975,000 |
Source: Public Records
Tax History
| Year | Tax Paid | Tax Assessment Tax Assessment Total Assessment is a certain percentage of the fair market value that is determined by local assessors to be the total taxable value of land and additions on the property. | Land | Improvement |
|---|---|---|---|---|
| 2025 | $10,642 | $861,070 | $644,420 | $216,650 |
| 2024 | $10,278 | $861,070 | $644,420 | $216,650 |
| 2023 | $10,019 | $861,070 | $644,420 | $216,650 |
| 2022 | $9,928 | $861,070 | $644,420 | $216,650 |
| 2021 | $10,889 | $904,400 | $703,920 | $200,480 |
| 2020 | $10,871 | $904,400 | $703,920 | $200,480 |
| 2019 | $10,979 | $904,400 | $703,920 | $200,480 |
| 2018 | $10,735 | $904,400 | $703,920 | $200,480 |
| 2017 | $10,870 | $904,400 | $703,920 | $200,480 |
| 2016 | $10,698 | $904,400 | $703,920 | $200,480 |
| 2015 | $10,541 | $883,960 | $782,600 | $101,360 |
| 2014 | $10,276 | $883,960 | $782,600 | $101,360 |
Source: Public Records
Map
Nearby Homes
- 10 Verona Dr
- 29 Sound Beach Ave
- 47 Owenoke Way
- 25 Dialstone Ln
- 20 Sound Beach Ave
- 2 Forest Ave
- 14 Bradbury Place
- 25 Summit Rd
- 17 Maple Dr
- 48 Meyer Place
- 16 Summit Rd
- 45 Sound Beach Avenue Extension
- 1465 E Putnam Ave Unit 306
- 45 Sunshine Ave
- 23 Thornhill Rd
- 10 Lockwood Rd
- 18 Griffith Rd
- 23 Westview Place
- 247 Riverside Ave
- 11 Field Rd
Your Personal Tour Guide
Ask me questions while you tour the home.